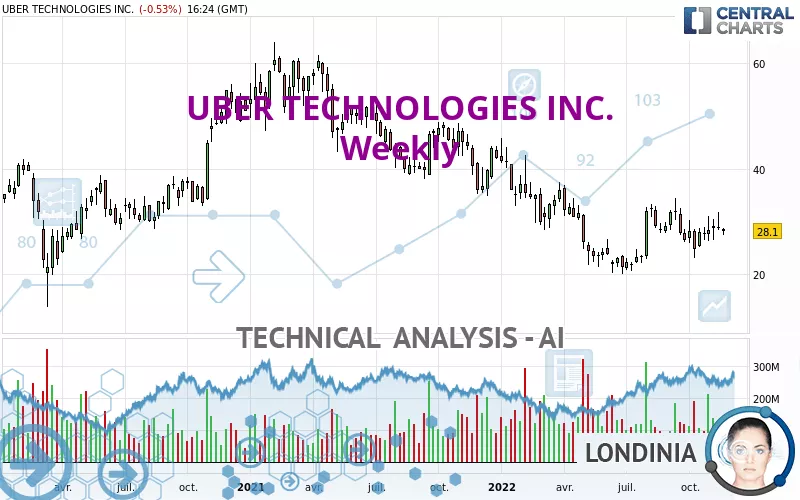
UBER TECHNOLOGIES INC. - Weekly - Technical analysis published on 11/22/2022 (GMT)
- 328
- 0
Click here for a new analysis!
- Timeframe : Weekly
- - Analysis generated on
- Status : INVALID

Summary of the analysis

Additional analysis
Quotes
The UBER TECHNOLOGIES INC. price is 28.10 USD. The price registered a decrease of -10.99% over 5 days and has been traded over the last 5 days between 27.31 USD and 29.41 USD. This implies that the 5 day price is +2.89% from its lowest point and -4.44% from its highest point.The Central Gaps scanner detects a bullish opening. A small advantage for buyers in the very short term.
Bullish opening
Type : Bullish
Timeframe : Openning
Here is a more detailed summary of the historical variations registered by UBER TECHNOLOGIES INC.:
Near a new LOW record (1 month)
Type : Bearish
Timeframe : Weekly
Technical
Technical analysis of this Weekly chart of UBER TECHNOLOGIES INC. indicates that the overall trend is strongly bearish. 82.14% of the signals given by moving averages are bearish. Caution: as the signals currently given by short-term moving averages are rather neutral, the global trend is slowing down. There is no crossing of moving average by the price or crossing of moving averages between themselves.
In fact, Central Analyzer took into account 18 technical indicators and the result was as follows: 5 are bullish, 8 are neutral and 5 are bearish. Central Indicators, the detector scanner for these technical indicators has recently detected several signals:
RSI indicator is back under 50
Type : Bearish
Timeframe : Weekly
Momentum indicator is back under 0
Type : Bearish
Timeframe : Weekly
Williams %R indicator is back under -50
Type : Bearish
Timeframe : Weekly
Central Patterns, the market scanner focusing on chart patterns, resistances and supports found these results:
Near resistance of triangle
Type : Bearish
Timeframe : Weekly
Near horizontal support
Type : Bullish
Timeframe : Weekly
Near support of channel
Type : Bullish
Timeframe : Weekly
No result was found by the Central Candlesticks scanner on Japanese candlesticks.
| S3 | S2 | S1 | Price | R1 | R2 | R3 | |
|---|---|---|---|---|---|---|---|
| ProTrendLines | 14.82 | 20.46 | 25.96 | 28.10 | 33.22 | 41.27 | 48.24 |
| Change (%) | -47.26% | -27.19% | -7.62% | - | +18.22% | +46.87% | +71.67% |
| Change | -13.28 | -7.64 | -2.14 | - | +5.12 | +13.17 | +20.14 |
| Level | Minor | Major | Major | - | Intermediate | Intermediate | Minor |
Pivot points can also be used to set your price objectives. Here is the price situation in relation to pivot points:
| Pivot points | S3 | S2 | S1 | PP | R1 | R2 | R3 |
|---|---|---|---|---|---|---|---|
| Standard | 27.24 | 27.62 | 27.94 | 28.32 | 28.64 | 29.02 | 29.34 |
| Camarilla | 28.06 | 28.12 | 28.19 | 28.25 | 28.31 | 28.38 | 28.44 |
| Woodie | 27.20 | 27.61 | 27.90 | 28.31 | 28.60 | 29.01 | 29.30 |
| Fibonacci | 27.62 | 27.89 | 28.06 | 28.32 | 28.59 | 28.76 | 29.02 |
| Pivot points | S3 | S2 | S1 | PP | R1 | R2 | R3 |
|---|---|---|---|---|---|---|---|
| Standard | 24.21 | 26.31 | 27.63 | 29.73 | 31.05 | 33.15 | 34.47 |
| Camarilla | 28.02 | 28.33 | 28.65 | 28.96 | 29.27 | 29.59 | 29.90 |
| Woodie | 23.83 | 26.12 | 27.25 | 29.54 | 30.67 | 32.96 | 34.09 |
| Fibonacci | 26.31 | 27.61 | 28.42 | 29.73 | 31.03 | 31.84 | 33.15 |
| Pivot points | S3 | S2 | S1 | PP | R1 | R2 | R3 |
|---|---|---|---|---|---|---|---|
| Standard | 15.63 | 19.28 | 22.93 | 26.58 | 30.23 | 33.88 | 37.53 |
| Camarilla | 24.56 | 25.23 | 25.90 | 26.57 | 27.24 | 27.91 | 28.58 |
| Woodie | 15.62 | 19.28 | 22.92 | 26.58 | 30.22 | 33.88 | 37.52 |
| Fibonacci | 19.28 | 22.07 | 23.80 | 26.58 | 29.37 | 31.10 | 33.88 |
Numerical data
The following are the details of the technical indicators and moving averages that were collected to generate this technical analysis:
| RSI (14): | 48.79 | |
| MACD (12,26,9): | -0.3000 | |
| Directional Movement: | 3.87 | |
| AROON (14): | -28.57 | |
| DEMA (21): | 27.42 | |
| Parabolic SAR (0,02-0,02-0,2): | 31.82 | |
| Elder Ray (13): | -0.10 | |
| Super Trend (3,10): | 21.70 | |
| Zig ZAG (10): | 28.09 | |
| VORTEX (21): | 1.0800 | |
| Stochastique (14,3,5): | 50.72 | |
| TEMA (21): | 28.92 | |
| Williams %R (14): | -55.53 | |
| Chande Momentum Oscillator (20): | -1.04 | |
| Repulse (5,40,3): | -2.9700 | |
| ROCnROLL: | 2 | |
| TRIX (15,9): | -0.2700 | |
| Courbe Coppock: | 4.92 |
| MA7: | 29.26 | |
| MA20: | 28.51 | |
| MA50: | 28.35 | |
| MA100: | 27.81 | |
| MAexp7: | 28.26 | |
| MAexp20: | 28.12 | |
| MAexp50: | 30.85 | |
| MAexp100: | 33.99 | |
| Price / MA7: | -3.96% | |
| Price / MA20: | -1.44% | |
| Price / MA50: | -0.88% | |
| Price / MA100: | +1.04% | |
| Price / MAexp7: | -0.57% | |
| Price / MAexp20: | -0.07% | |
| Price / MAexp50: | -8.91% | |
| Price / MAexp100: | -17.33% |
News
The last news published on UBER TECHNOLOGIES INC. at the time of the generation of this analysis was as follows:
- SHAREHOLDER ACTION REMINDER: The Schall Law Firm Encourages Investors in Uber Technologies, Inc. with Losses of $100,000 to Contact the Firm
- INVESTOR ACTION NOTICE: The Schall Law Firm Encourages Investors in Uber Technologies, Inc. with Losses of $100,000 to Contact the Firm
- SHAREHOLDER ACTION NOTICE: The Schall Law Firm Encourages Investors in Uber Technologies, Inc. with Losses of $100,000 to Contact the Firm
- INVESTOR ACTION NOTICE: The Schall Law Firm Encourages Investors in Uber Technologies, Inc. with Losses of $100,000 to Contact the Firm
- ONGOING INVESTIGATION REMINDER: The Schall Law Firm Encourages Investors in Uber Technologies, Inc. with Losses of $100,000 to Contact the Firm
About author

Online


Add a comment
Comments
0 comments on the analysis UBER TECHNOLOGIES INC. - Weekly