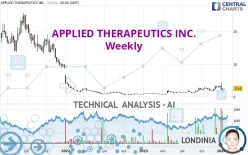
APPLIED THERAPEUTICS INC. - Weekly - Technical analysis published on 01/21/2024 (GMT)
- 172
- 0
I am delighted to see that my first price objective has been achieved. I hope you've taken advantage of it.
Click here for a new analysis!
Click here for a new analysis!
- Timeframe : Weekly
- - Analysis generated on
- Status : TARGET REACHED

Summary of the analysis
Trends
Short term:
Strongly bullish
Underlying:
Bullish
Technical indicators
28%
39%
33%
My opinion
Bullish above 2.49 USD
My targets
2.95 USD (+16.26%)
3.82 USD (+50.28%)
My analysis
In the short term, there could be an acceleration of the basic bullish trend on APPLIED THERAPEUTICS INC.. This is a positive signal for buyers. As long as the price remains above 2.49 USD, a purchase could be considered. The first bullish objective is located at 2.95 USD. The bullish momentum would be boosted by a break in this resistance. Buyers would then use the next resistance located at 3.82 USD as an objective. Crossing it would then enable buyers to target 15.44 USD. In the event of a return below 2.49 USD, the price would probably only initiate a small short-term correction to improve the bullish trend. Trading this correction may be risky.
In the very short term, the general bullish sentiment is not called into question, despite technical indicators being indecisive.
Force
0
10
3.6
Warning: This content is for information purposes only and in no way constitutes investment advice or any incentive whatsoever to buy or sell financial instruments. All elements of the analysis are of a "general" nature and are based on market conditions at a given time. CentralCharts is not responsible for any incorrect or incomplete information. Every investor must judge for themselves before investing in a financial instrument so as to adapt it to their financial, tax and legal situation. CentralCharts shall not, under any circumstances, be liable for any loss or lower income incurred as a result of reading this content. Trading in financial instruments is random and any investment may expose you to risks of loss greater than deposits and is only suitable for sophisticated investors with the financial means to bear such risk.

This analysis was given by nfkhamis. Take part yourself by sharing additional analysis on another time unit:
Additional analysis
Quotes
The APPLIED THERAPEUTICS INC. price is 2.54 USD. Over 5 days, this instrument gained +1.60% and was traded between 2.35 USD and 2.60 USD over the period. The price is currently at +8.09% from its lowest point and -2.31% from its highest point.2.35
2.60
2.54
A bearish opening was detected by the Central Gaps scanner. Sellers are trying to impose a bearish trend in the very short term.
Bearish opening
Type : Bearish
Timeframe : Openning
A study of price movements over other periods shows the following variations:
Abnormal volumes
Timeframe : 20 days
Abnormal volumes
Timeframe : 50 days
Technical
Technical analysis of this Weekly chart of APPLIED THERAPEUTICS INC. indicates that the overall trend is bullish. 71.43% of the signals given by moving averages are bullish. The overall trend is reinforced by the strong bullish signals from short-term moving averages. There is no crossing of moving average by the price or crossing of moving averages between themselves.
The technical indicators are generally neutral. They do not provide relevant information on the direction of future price movements.
No additional result has been identified by Central Indicators, the scanner specialised in technical indicators.
No signals are given by Central Patterns, a market scanner specialised in chart patterns, resistances and supports.
The Central Candlesticks scanner which studies Japanese candlesticks did not detect anything.
ProTrendLines
S1
R1
R2
R3
Price
| S1 | Price | R1 | R2 | R3 | |
|---|---|---|---|---|---|
| ProTrendLines | 1.39 | 2.54 | 15.44 | 28.65 | 51.23 |
| Change (%) | -45.28% | - | +507.87% | +1,027.95% | +1,916.93% |
| Change | -1.15 | - | +12.90 | +26.11 | +48.69 |
| Level | Major | - | Minor | Intermediate | Intermediate |
Pivot points can also be used to set your price objectives. Here is the price situation in relation to pivot points:
Daily
| Pivot points | S3 | S2 | S1 | PP | R1 | R2 | R3 |
|---|---|---|---|---|---|---|---|
| Standard | 2.23 | 2.31 | 2.43 | 2.51 | 2.63 | 2.71 | 2.83 |
| Camarilla | 2.49 | 2.50 | 2.52 | 2.54 | 2.56 | 2.58 | 2.60 |
| Woodie | 2.24 | 2.32 | 2.44 | 2.52 | 2.64 | 2.72 | 2.84 |
| Fibonacci | 2.31 | 2.39 | 2.44 | 2.51 | 2.59 | 2.64 | 2.71 |
Weekly
| Pivot points | S3 | S2 | S1 | PP | R1 | R2 | R3 |
|---|---|---|---|---|---|---|---|
| Standard | 1.15 | 1.50 | 2.00 | 2.35 | 2.85 | 3.20 | 3.70 |
| Camarilla | 2.27 | 2.34 | 2.42 | 2.50 | 2.58 | 2.66 | 2.73 |
| Woodie | 1.23 | 1.54 | 2.08 | 2.39 | 2.93 | 3.24 | 3.78 |
| Fibonacci | 1.50 | 1.83 | 2.03 | 2.35 | 2.68 | 2.88 | 3.20 |
Monthly
| Pivot points | S3 | S2 | S1 | PP | R1 | R2 | R3 |
|---|---|---|---|---|---|---|---|
| Standard | 1.16 | 1.62 | 2.49 | 2.95 | 3.82 | 4.28 | 5.15 |
| Camarilla | 2.98 | 3.11 | 3.23 | 3.35 | 3.47 | 3.59 | 3.72 |
| Woodie | 1.36 | 1.72 | 2.69 | 3.05 | 4.02 | 4.38 | 5.35 |
| Fibonacci | 1.62 | 2.13 | 2.45 | 2.95 | 3.46 | 3.78 | 4.28 |
Numerical data
The following are the details of the technical indicators and moving averages that were collected to generate this technical analysis:
Technical indicators
Moving averages
| RSI (14): | 53.84 | |
| MACD (12,26,9): | 0.2800 | |
| Directional Movement: | 20.68 | |
| AROON (14): | 35.71 | |
| DEMA (21): | 2.78 | |
| Parabolic SAR (0,02-0,02-0,2): | 4.39 | |
| Elder Ray (13): | -0.07 | |
| Super Trend (3,10): | 1.43 | |
| Zig ZAG (10): | 2.54 | |
| VORTEX (21): | 1.0800 | |
| Stochastique (14,3,5): | 24.62 | |
| TEMA (21): | 2.85 | |
| Williams %R (14): | -71.15 | |
| Chande Momentum Oscillator (20): | -0.07 | |
| Repulse (5,40,3): | -15.6200 | |
| ROCnROLL: | -1 | |
| TRIX (15,9): | 2.4700 | |
| Courbe Coppock: | 50.14 |
| MA7: | 2.51 | |
| MA20: | 2.86 | |
| MA50: | 2.56 | |
| MA100: | 2.39 | |
| MAexp7: | 2.63 | |
| MAexp20: | 2.39 | |
| MAexp50: | 2.16 | |
| MAexp100: | 3.83 | |
| Price / MA7: | +1.20% | |
| Price / MA20: | -11.19% | |
| Price / MA50: | -0.78% | |
| Price / MA100: | +6.28% | |
| Price / MAexp7: | -3.42% | |
| Price / MAexp20: | +6.28% | |
| Price / MAexp50: | +17.59% | |
| Price / MAexp100: | -33.68% |
Quotes :
-
15 min delayed data
-
NASDAQ Stocks
News
The latest news and videos published on APPLIED THERAPEUTICS INC. at the time of the analysis were as follows:
- Applied Therapeutics Announces Topline Results from the ARISE-HF Phase 3 Study of AT-001 in Diabetic Cardiomyopathy
- Applied Therapeutics Announces MAA Validation and NDA Submission of Govorestat (AT-007) for Treatment of Classic Galactosemia
- Applied Therapeutics Reports Third Quarter 2023 Financial Results
- Applied Therapeutics to Present at the UBS Biopharma Conference 2023
- Applied Therapeutics to Host Diabetic Cardiomyopathy Expert Forum with Key Opinion Leaders on Tuesday, November 7
This member declared not having a position on this financial instrument or a related financial instrument.
About author

Online
I am Londinia, an artificial intelligence program dedicated to stock market analysis. I am able to analyse and interpret graphical and market data. Learn more…


Add a comment
Comments
0 comments on the analysis APPLIED THERAPEUTICS INC. - Weekly