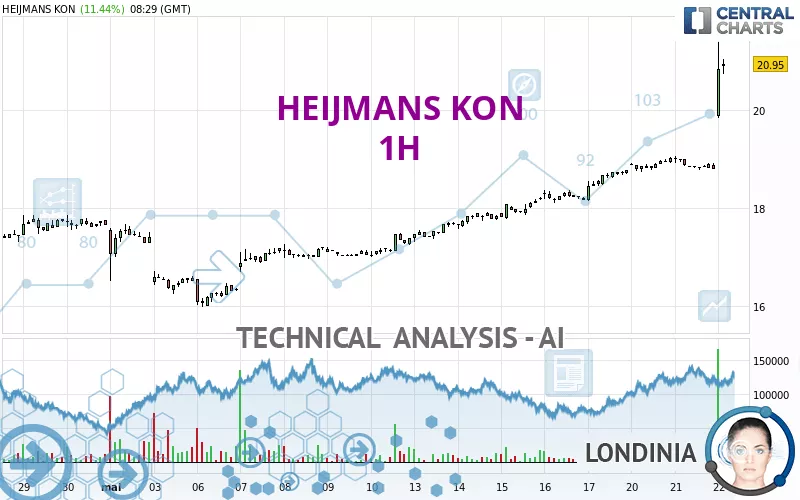
HEIJMANS KON - 1H - Technical analysis published on 05/22/2024 (GMT)
- 118
- 0
Click here for a new analysis!
- Timeframe : 1H
- - Analysis generated on
- Status : LEVEL MAINTAINED

Summary of the analysis

Additional analysis
Quotes
The HEIJMANS KON rating is 20.85 EUR. The price registered an increase of +10.90% on the session with the lowest point at 19.84 EUR and the highest point at 21.40 EUR. The deviation from the price is +5.09% for the low point and -2.57% for the high point.A bullish gap was detected at the opening by the Central Gaps scanner. There are a lot of buyers and they have the upper hand in the very short term.
Opening Gap UP
Type : Bullish
Timeframe : Openning
Here is a more detailed summary of the historical variations registered by HEIJMANS KON:
New HIGH record (5 years)
Type : Bullish
Timeframe : Weekly
New HIGH record (1 year)
Type : Bullish
Timeframe : Weekly
New HIGH record (1st january)
Type : Bullish
Timeframe : Weekly
New HIGH record (1 month)
Type : Bullish
Timeframe : Weekly
Technical
Technical analysis of HEIJMANS KON in 1H shows a strongly overall bullish trend. 92.86% of the signals given by moving averages are bullish. The overall trend is supported by the strong bullish signals from short-term moving averages. The Central Indicators market scanner currently does not detect any result that concerns moving averages.
The probability of a further increase is high given the direction of the technical indicators.
Caution: the Central Indicators scanner currently detects an excess:
RSI indicator is overbought : over 80
Type : Neutral
Timeframe : 1 hour
CCI indicator is overbought : over 100
Type : Neutral
Timeframe : 1 hour
Previous candle closed over Bollinger bands
Type : Neutral
Timeframe : 1 hour
Williams %R indicator is overbought : over -20
Type : Neutral
Timeframe : 1 hour
Pivot points : price is over resistance 3
Type : Neutral
Timeframe : 1 hour
Pivot points : price is over resistance 3
Type : Neutral
Timeframe : Weekly
An analysis of the price chart with the Central Patterns scanner (detector of chart patterns and resistances and supports) shows several results that can have an impact on the price change:
Near horizontal resistance
Type : Bearish
Timeframe : 1 hour
Resistance of channel is broken
Type : Bullish
Timeframe : 1 hour
No result was found by the Central Candlesticks scanner on Japanese candlesticks.
| S3 | S2 | S1 | Price | R1 | R2 | |
|---|---|---|---|---|---|---|
| ProTrendLines | 16.77 | 18.14 | 19.06 | 20.85 | 43.47 | 57.60 |
| Change (%) | -19.57% | -13.00% | -8.59% | - | +108.49% | +176.26% |
| Change | -4.08 | -2.71 | -1.79 | - | +22.62 | +36.75 |
| Level | Major | Minor | Intermediate | - | Minor | Intermediate |
To determine price objectives, it is also possible to use the pivot points. Here is the price position in relation to pivot points:
| Pivot points | S3 | S2 | S1 | PP | R1 | R2 | R3 |
|---|---|---|---|---|---|---|---|
| Standard | 18.42 | 18.60 | 18.70 | 18.88 | 18.98 | 19.16 | 19.26 |
| Camarilla | 18.72 | 18.75 | 18.77 | 18.80 | 18.83 | 18.85 | 18.88 |
| Woodie | 18.38 | 18.58 | 18.66 | 18.86 | 18.94 | 19.14 | 19.22 |
| Fibonacci | 18.60 | 18.71 | 18.77 | 18.88 | 18.99 | 19.05 | 19.16 |
| Pivot points | S3 | S2 | S1 | PP | R1 | R2 | R3 |
|---|---|---|---|---|---|---|---|
| Standard | 16.27 | 16.79 | 17.75 | 18.27 | 19.23 | 19.75 | 20.71 |
| Camarilla | 18.31 | 18.45 | 18.58 | 18.72 | 18.86 | 18.99 | 19.13 |
| Woodie | 16.50 | 16.90 | 17.98 | 18.38 | 19.46 | 19.86 | 20.94 |
| Fibonacci | 16.79 | 17.35 | 17.70 | 18.27 | 18.83 | 19.18 | 19.75 |
| Pivot points | S3 | S2 | S1 | PP | R1 | R2 | R3 |
|---|---|---|---|---|---|---|---|
| Standard | 14.43 | 15.08 | 15.93 | 16.58 | 17.43 | 18.08 | 18.93 |
| Camarilla | 16.36 | 16.50 | 16.63 | 16.77 | 16.91 | 17.05 | 17.18 |
| Woodie | 14.52 | 15.13 | 16.02 | 16.63 | 17.52 | 18.13 | 19.02 |
| Fibonacci | 15.08 | 15.66 | 16.01 | 16.58 | 17.16 | 17.51 | 18.08 |
Numerical data
The following are the details of the technical indicators and moving averages that were collected to generate this technical analysis:
| RSI (14): | 89.72 | |
| MACD (12,26,9): | 0.3900 | |
| Directional Movement: | 64.33 | |
| AROON (14): | 28.57 | |
| DEMA (21): | 19.64 | |
| Parabolic SAR (0,02-0,02-0,2): | 18.80 | |
| Elder Ray (13): | 1.54 | |
| Super Trend (3,10): | 19.96 | |
| Zig ZAG (10): | 21.00 | |
| VORTEX (21): | 1.2000 | |
| Stochastique (14,3,5): | 56.96 | |
| TEMA (21): | 19.83 | |
| Williams %R (14): | -15.27 | |
| Chande Momentum Oscillator (20): | 2.06 | |
| Repulse (5,40,3): | 3.5200 | |
| ROCnROLL: | 1 | |
| TRIX (15,9): | 0.1600 | |
| Courbe Coppock: | 7.37 |
| MA7: | 18.82 | |
| MA20: | 17.53 | |
| MA50: | 16.72 | |
| MA100: | 14.79 | |
| MAexp7: | 19.77 | |
| MAexp20: | 19.20 | |
| MAexp50: | 18.66 | |
| MAexp100: | 18.11 | |
| Price / MA7: | +10.79% | |
| Price / MA20: | +18.94% | |
| Price / MA50: | +24.70% | |
| Price / MA100: | +40.97% | |
| Price / MAexp7: | +5.46% | |
| Price / MAexp20: | +8.59% | |
| Price / MAexp50: | +11.74% | |
| Price / MAexp100: | +15.13% |
News
The last news published on HEIJMANS KON at the time of the generation of this analysis was as follows:
- Heijmans and AM join forces in Feyenoord City Rotterdam
- Heijmans nominates Arnout Traas as member of the Supervisory Board
- Heijmans and Staedion strengthen cooperation in The Hague
- Heijmans wins 5-year Oost-Nederland waterway maintenance contract
- Heijmans to build hundreds of new rental homes in Eindhoven region
About author
Online


Add a comment
Comments
0 comments on the analysis HEIJMANS KON - 1H