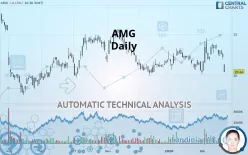
AMG - Daily - Technical analysis published on 02/24/2020 (GMT)
- 409
- 0
- Who voted?
Click here for a new analysis!
- Timeframe : Daily
- - Analysis generated on
- Status : TARGET REACHED

Summary of the analysis

Additional analysis
Quotes
AMG rating 20.44 EUR. The price is lower by -8.14% since the last closing and was between 20.40 EUR and 21.33 EUR. This implies that the price is at +0.20% from its lowest and at -4.17% from its highest.The Central Gaps scanner detects the formation of a bearish gap marking the strong presence of sellers ahead of buyers at the opening. This formed a quotation gap.
Opening Gap DOWN
Type : Bearish
Timeframe : Openning
So that you have an overall view of the price change, here is a table showing the variations over several periods:
Near a new LOW record (1st january)
Type : Bearish
Timeframe : Weekly
Near a new LOW record (1 month)
Type : Bearish
Timeframe : Weekly
Technical
A technical analysis in Daily of this AMG chart shows a bearish trend. The signals given by moving averages are 67.86% bearish. This bearish trend is reinforced by the strong signals currently being given by short-term moving averages. The Central Indicators scanner detects bearish signals on moving averages that could impact this trend:
Bearish trend reversal : adaptative moving average 50
Type : Bearish
Timeframe : Daily
Bearish trend reversal : adaptative moving average 100
Type : Bearish
Timeframe : Daily
Bearish price crossover with Moving Average 20
Type : Bearish
Timeframe : Daily
Bearish price crossover with Moving Average 100
Type : Bearish
Timeframe : Daily
Bearish price crossover with adaptative moving average 50
Type : Bearish
Timeframe : Daily
Bearish price crossover with adaptative moving average 100
Type : Bearish
Timeframe : Daily
The technical indicators are generally neutral. They do not provide relevant information on the direction of future price movements.
Other results related to technical indicators were also found by the Central Indicators scanner:
Pivot points : price is under support 3
Type : Neutral
Timeframe : Daily
Pivot points : price is under support 3
Type : Neutral
Timeframe : Weekly
RSI indicator is back under 50
Type : Bearish
Timeframe : Daily
MACD crosses DOWN its Moving Average
Type : Bearish
Timeframe : Daily
Momentum indicator is back under 0
Type : Bearish
Timeframe : Daily
Williams %R indicator is back under -50
Type : Bearish
Timeframe : Daily
Central Patterns, the market scanner focusing on chart patterns, resistances and supports found these results:
Horizontal support is broken
Type : Bearish
Timeframe : Daily
Support of channel is broken
Type : Bearish
Timeframe : Daily
No result was found by the Central Candlesticks scanner on Japanese candlesticks.
| S3 | S2 | S1 | Price | R1 | R2 | R3 | |
|---|---|---|---|---|---|---|---|
| ProTrendLines | 18.00 | 19.47 | 20.35 | 20.44 | 21.93 | 22.95 | 23.75 |
| Change (%) | -11.94% | -4.75% | -0.44% | - | +7.29% | +12.28% | +16.19% |
| Change | -2.44 | -0.97 | -0.09 | - | +1.49 | +2.51 | +3.31 |
| Level | Minor | Minor | Major | - | Major | Intermediate | Intermediate |
Attention could also be paid to pivot points to set price objectives:
| Pivot points | S3 | S2 | S1 | PP | R1 | R2 | R3 |
|---|---|---|---|---|---|---|---|
| Standard | 21.09 | 21.53 | 21.89 | 22.33 | 22.69 | 23.13 | 23.49 |
| Camarilla | 22.03 | 22.10 | 22.18 | 22.25 | 22.32 | 22.40 | 22.47 |
| Woodie | 21.05 | 21.51 | 21.85 | 22.31 | 22.65 | 23.11 | 23.45 |
| Fibonacci | 21.53 | 21.84 | 22.02 | 22.33 | 22.64 | 22.82 | 23.13 |
| Pivot points | S3 | S2 | S1 | PP | R1 | R2 | R3 |
|---|---|---|---|---|---|---|---|
| Standard | 19.76 | 20.86 | 21.56 | 22.66 | 23.36 | 24.46 | 25.16 |
| Camarilla | 21.76 | 21.92 | 22.09 | 22.25 | 22.42 | 22.58 | 22.75 |
| Woodie | 19.55 | 20.76 | 21.35 | 22.56 | 23.15 | 24.36 | 24.95 |
| Fibonacci | 20.86 | 21.55 | 21.98 | 22.66 | 23.35 | 23.78 | 24.46 |
| Pivot points | S3 | S2 | S1 | PP | R1 | R2 | R3 |
|---|---|---|---|---|---|---|---|
| Standard | 17.03 | 18.81 | 19.71 | 21.49 | 22.39 | 24.17 | 25.07 |
| Camarilla | 19.86 | 20.11 | 20.35 | 20.60 | 20.85 | 21.09 | 21.34 |
| Woodie | 16.58 | 18.59 | 19.26 | 21.27 | 21.94 | 23.95 | 24.62 |
| Fibonacci | 18.81 | 19.84 | 20.47 | 21.49 | 22.52 | 23.15 | 24.17 |
Numerical data
The following is the status of the technical indicators and moving averages at the time of publication of this technical analysis:
| RSI (14): | 38.46 | |
| MACD (12,26,9): | 0.0700 | |
| Directional Movement: | -11.51 | |
| AROON (14): | -85.71 | |
| DEMA (21): | 22.51 | |
| Parabolic SAR (0,02-0,02-0,2): | 24.48 | |
| Elder Ray (13): | -1.47 | |
| Super Trend (3,10): | 23.72 | |
| Zig ZAG (10): | 20.59 | |
| VORTEX (21): | 0.9300 | |
| Stochastique (14,3,5): | 33.75 | |
| TEMA (21): | 22.47 | |
| Williams %R (14): | -97.49 | |
| Chande Momentum Oscillator (20): | -2.14 | |
| Repulse (5,40,3): | -6.5800 | |
| ROCnROLL: | 2 | |
| TRIX (15,9): | 0.1700 | |
| Courbe Coppock: | 8.89 |
| MA7: | 22.56 | |
| MA20: | 22.31 | |
| MA50: | 21.96 | |
| MA100: | 22.54 | |
| MAexp7: | 22.21 | |
| MAexp20: | 22.36 | |
| MAexp50: | 22.22 | |
| MAexp100: | 22.41 | |
| Price / MA7: | -9.40% | |
| Price / MA20: | -8.38% | |
| Price / MA50: | -6.92% | |
| Price / MA100: | -9.32% | |
| Price / MAexp7: | -7.97% | |
| Price / MAexp20: | -8.59% | |
| Price / MAexp50: | -8.01% | |
| Price / MAexp100: | -8.79% |
News
The latest news and videos published on AMG at the time of the analysis were as follows:
- AMG Advanced Metallurgical Group N.V. Schedule for Full Year and Fourth Quarter 2019 Earnings Release
- AMG Advanced Metallurgical Group N.V. Announces Long-Term Spent Catalyst Recycling Agreement
- Saudi Arabian General Investment Authority, Shell and AMG Sign Agreement to Assess Building a Spent Residue Upgrading Catalyst Recycling Facility
- AMG Advanced Metallurgical Group N.V. Completes Acquisition of International Specialty Alloys
- AMG Advanced Metallurgical Group N.V. Starts Basic Engineering for a Lithium Hydroxide Refining Plant in Germany
About author

Online


Add a comment
Comments
0 comments on the analysis AMG - Daily