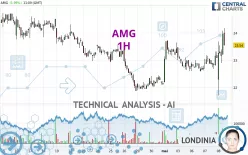
AMG - 1H - Technical analysis published on 05/08/2024 (GMT)
- 145
- 0
Click here for a new analysis!
- Timeframe : 1H
- - Analysis generated on
- Status : INVALID

Summary of the analysis

Additional analysis
Quotes
The AMG price is 24.10 EUR. The price has increased by +4.42% since the last closing with the lowest point at 21.72 EUR and the highest point at 24.16 EUR. The deviation from the price is +10.96% for the low point and -0.25% for the high point.The Central Gaps scanner detects the formation of a bearish gap marking the strong presence of sellers ahead of buyers at the opening. This formed a quotation gap.
Opening Gap DOWN
Type : Bearish
Timeframe : Openning
So that you have an overall view of the price change, here is a table showing the variations over several periods:
Near a new HIGH record (1st january)
Type : Bullish
Timeframe : Weekly
Near a new HIGH record (1 month)
Type : Bullish
Timeframe : Weekly
New LOW record (1 month)
Type : Bearish
Timeframe : Weekly
Technical
Technical analysis of this 1H chart of AMG indicates that the overall trend is strongly bullish. The signals given by the moving averages are 85.71% bullish. This strong bullish trend is confirmed by the strong signals currently being given by short-term moving averages. An assessment of moving averages reveals a bullish signal that could impact this trend:
Bullish trend reversal : Moving Average 100
Type : Bullish
Timeframe : 1 hour
An assessment of technical indicators shows a strong bullish signal.
Caution: the Central Indicators scanner currently detects an excess:
RSI indicator is overbought : over 70
Type : Neutral
Timeframe : 1 hour
CCI indicator is overbought : over 100
Type : Neutral
Timeframe : 1 hour
Williams %R indicator is overbought : over -20
Type : Neutral
Timeframe : 1 hour
Pivot points : price is over resistance 1
Type : Neutral
Timeframe : Weekly
Pivot points : price is over resistance 3
Type : Neutral
Timeframe : 1 hour
Parabolic SAR indicator bullish reversal
Type : Bullish
Timeframe : 1 hour
An analysis of the price chart with the Central Patterns scanner (detector of chart patterns and resistances and supports) shows several results that can have an impact on the price change:
Near horizontal resistance
Type : Bearish
Timeframe : 1 hour
Resistance of channel is broken
Type : Bullish
Timeframe : 1 hour
The presence of a bearish pattern in Japanese candlesticks detected by Central Candlesticks that could cause a correction in the very short term was also detected:
Bearish doji star
Type : Bearish
Timeframe : 1 hour
| S3 | S2 | S1 | Price | R1 | R2 | R3 | |
|---|---|---|---|---|---|---|---|
| ProTrendLines | 22.58 | 23.03 | 23.75 | 24.10 | 24.49 | 24.86 | 26.71 |
| Change (%) | -6.31% | -4.44% | -1.45% | - | +1.62% | +3.15% | +10.83% |
| Change | -1.52 | -1.07 | -0.35 | - | +0.39 | +0.76 | +2.61 |
| Level | Major | Intermediate | Major | - | Major | Minor | Minor |
Pivot points can also be used to set your price objectives. Here is the price situation in relation to pivot points:
| Pivot points | S3 | S2 | S1 | PP | R1 | R2 | R3 |
|---|---|---|---|---|---|---|---|
| Standard | 22.09 | 22.39 | 22.73 | 23.03 | 23.37 | 23.67 | 24.01 |
| Camarilla | 22.90 | 22.96 | 23.02 | 23.08 | 23.14 | 23.20 | 23.26 |
| Woodie | 22.12 | 22.40 | 22.76 | 23.04 | 23.40 | 23.68 | 24.04 |
| Fibonacci | 22.39 | 22.63 | 22.78 | 23.03 | 23.27 | 23.42 | 23.67 |
| Pivot points | S3 | S2 | S1 | PP | R1 | R2 | R3 |
|---|---|---|---|---|---|---|---|
| Standard | 19.97 | 20.93 | 21.81 | 22.77 | 23.65 | 24.61 | 25.49 |
| Camarilla | 22.17 | 22.34 | 22.51 | 22.68 | 22.85 | 23.02 | 23.19 |
| Woodie | 19.92 | 20.91 | 21.76 | 22.75 | 23.60 | 24.59 | 25.44 |
| Fibonacci | 20.93 | 21.64 | 22.07 | 22.77 | 23.48 | 23.91 | 24.61 |
| Pivot points | S3 | S2 | S1 | PP | R1 | R2 | R3 |
|---|---|---|---|---|---|---|---|
| Standard | 16.40 | 18.64 | 20.38 | 22.62 | 24.36 | 26.60 | 28.34 |
| Camarilla | 21.03 | 21.39 | 21.76 | 22.12 | 22.49 | 22.85 | 23.22 |
| Woodie | 16.15 | 18.52 | 20.13 | 22.50 | 24.11 | 26.48 | 28.09 |
| Fibonacci | 18.64 | 20.16 | 21.10 | 22.62 | 24.14 | 25.08 | 26.60 |
Numerical data
The following is the status of the technical indicators and moving averages at the time of publication of this technical analysis:
| RSI (14): | 73.28 | |
| MACD (12,26,9): | 0.2200 | |
| Directional Movement: | -4.95 | |
| AROON (14): | 28.57 | |
| DEMA (21): | 23.41 | |
| Parabolic SAR (0,02-0,02-0,2): | 21.77 | |
| Elder Ray (13): | 0.77 | |
| Super Trend (3,10): | 22.76 | |
| Zig ZAG (10): | 24.10 | |
| VORTEX (21): | 1.1400 | |
| Stochastique (14,3,5): | 89.46 | |
| TEMA (21): | 23.60 | |
| Williams %R (14): | 0.00 | |
| Chande Momentum Oscillator (20): | 1.14 | |
| Repulse (5,40,3): | 3.7000 | |
| ROCnROLL: | 1 | |
| TRIX (15,9): | 0.0600 | |
| Courbe Coppock: | 5.69 |
| MA7: | 22.92 | |
| MA20: | 23.41 | |
| MA50: | 22.31 | |
| MA100: | 21.44 | |
| MAexp7: | 23.52 | |
| MAexp20: | 23.18 | |
| MAexp50: | 23.00 | |
| MAexp100: | 23.01 | |
| Price / MA7: | +5.15% | |
| Price / MA20: | +2.95% | |
| Price / MA50: | +8.02% | |
| Price / MA100: | +12.41% | |
| Price / MAexp7: | +2.47% | |
| Price / MAexp20: | +3.97% | |
| Price / MAexp50: | +4.78% | |
| Price / MAexp100: | +4.74% |
News
The last news published on AMG at the time of the generation of this analysis was as follows:
- AMG Reports First Quarter 2024 Results: Lithium Projects on Schedule
- AMG Schedule for First Quarter 2024 Earnings Release
- AMG Critical Materials N.V. Completes Issuance of $100 Million Incremental Term Loan
- Nuclear Fuel from Nuclear Waste: Formation of NewMOX SAS, France
- AMG Critical Materials N.V. Publishes Agenda for the 2024 Annual General Meeting and Expands Management Board
About author
Online


Add a comment
Comments
0 comments on the analysis AMG - 1H