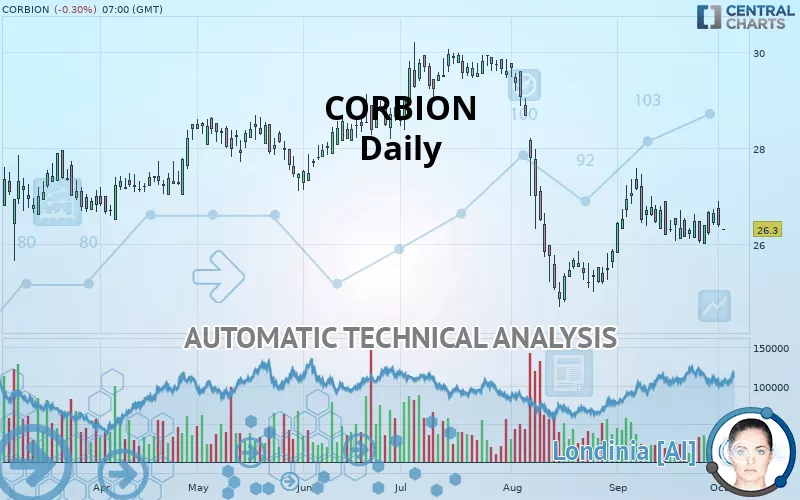
CORBION - Daily - Technical analysis published on 10/02/2019 (GMT)
- 267
- 0
- Who voted?
Click here for a new analysis!
- Timeframe : Daily
- - Analysis generated on
- Status : TARGET REACHED
Summary of the analysis

Additional analysis
Quotes
The CORBION price is 26.30 EUR. On the day, this instrument lost -0.30% with the lowest point at 26.30 EUR and the highest point at 26.30 EUR. The deviation from the price is 0% for the low point and 0% for the high point.The Central Gaps scanner detects the formation of a bearish gap marking the strong presence of sellers ahead of buyers at the opening. This formed a quotation gap.
Opening Gap DOWN
Type : Bearish
Timeframe : Openning
So that you have an overall view of the price change, here is a table showing the variations over several periods:
Technical
A technical analysis in Daily of this CORBION chart shows a sharp bearish trend. The signals given by moving averages are 92.86% bearish. This strong bearish trend is confirmed by the strong signals currently being given by short-term moving averages. The Central Indicators scanner detects bullish and bearish signals on moving averages that could impact this trend:
Bearish trend reversal : Moving Average 20
Type : Bearish
Timeframe : Daily
Bullish price crossover with Moving Average 20
Type : Bullish
Timeframe : Daily
An assessment of technical indicators does not currently provide any relevant information to suggest whether the signal given by the technical indicators is more bullish or bearish.
Caution: the Central Indicators scanner currently detects an excess:
Williams %R indicator is overbought : over -20
Type : Neutral
Timeframe : Daily
RSI indicator is back over 50
Type : Bullish
Timeframe : Daily
Price is back over the pivot point
Type : Bullish
Timeframe : Daily
Momentum indicator is back over 0
Type : Bullish
Timeframe : Daily
Williams %R indicator is back over -50
Type : Bullish
Timeframe : Daily
An analysis of the price chart with the Central Patterns scanner (detector of chart patterns and resistances and supports) shows several results that can have an impact on the price change:
Near horizontal resistance
Type : Bearish
Timeframe : Daily
Resistance of channel is broken
Type : Bullish
Timeframe : Daily
The presence of a bullish Japanese candlestick pattern detected by Central Candlesticks that could cause a very short term rebound was also detected:
Bullish harami
Type : Bullish
Timeframe : Daily
| S3 | S2 | S1 | Price | R1 | R2 | R3 | |
|---|---|---|---|---|---|---|---|
| ProTrendLines | 24.70 | 25.47 | 26.06 | 26.30 | 26.91 | 27.89 | 28.50 |
| Change (%) | -6.08% | -3.16% | -0.91% | - | +2.32% | +6.05% | +8.37% |
| Change | -1.60 | -0.83 | -0.24 | - | +0.61 | +1.59 | +2.20 |
| Level | Major | Intermediate | Intermediate | - | Major | Minor | Intermediate |
Attention could also be paid to pivot points to set price objectives:
| Pivot points | S3 | S2 | S1 | PP | R1 | R2 | R3 |
|---|---|---|---|---|---|---|---|
| Standard | 26.10 | 26.24 | 26.19 | 26.53 | 26.73 | 27.07 | 27.27 |
| Camarilla | 26.55 | 26.58 | 26.61 | 26.64 | 26.67 | 26.70 | 26.73 |
| Woodie | 26.13 | 26.26 | 26.47 | 26.60 | 26.81 | 26.94 | 27.15 |
| Fibonacci | 26.24 | 26.37 | 26.45 | 26.58 | 26.71 | 26.79 | 26.92 |
| Pivot points | S3 | S2 | S1 | PP | R1 | R2 | R3 |
|---|---|---|---|---|---|---|---|
| Standard | 25.24 | 25.62 | 25.92 | 26.30 | 26.60 | 26.98 | 27.28 |
| Camarilla | 26.03 | 26.10 | 26.16 | 26.22 | 26.28 | 26.35 | 26.41 |
| Woodie | 25.20 | 25.60 | 25.88 | 26.28 | 26.56 | 26.96 | 27.24 |
| Fibonacci | 25.62 | 25.88 | 26.04 | 26.30 | 26.56 | 26.72 | 26.98 |
| Pivot points | S3 | S2 | S1 | PP | R1 | R2 | R3 |
|---|---|---|---|---|---|---|---|
| Standard | 23.99 | 24.89 | 25.77 | 26.67 | 27.55 | 28.45 | 29.33 |
| Camarilla | 26.15 | 26.31 | 26.48 | 26.64 | 26.80 | 26.97 | 27.13 |
| Woodie | 23.97 | 24.89 | 25.75 | 26.67 | 27.53 | 28.45 | 29.31 |
| Fibonacci | 24.89 | 25.57 | 25.99 | 26.67 | 27.35 | 27.77 | 28.45 |
Numerical data
The following is the status of the technical indicators and moving averages at the time of publication of this technical analysis:
| RSI (14): | 48.83 | |
| MACD (12,26,9): | -0.0800 | |
| Directional Movement: | 5.70 | |
| AROON (14): | -78.57 | |
| DEMA (21): | 26.24 | |
| Parabolic SAR (0,02-0,02-0,2): | 26.00 | |
| Elder Ray (13): | 0.24 | |
| Super Trend (3,10): | 25.78 | |
| Zig ZAG (10): | 26.38 | |
| VORTEX (21): | 1.0200 | |
| Stochastique (14,3,5): | 43.06 | |
| TEMA (21): | 26.45 | |
| Williams %R (14): | -56.82 | |
| Chande Momentum Oscillator (20): | -0.32 | |
| Repulse (5,40,3): | -2.1200 | |
| ROCnROLL: | -1 | |
| TRIX (15,9): | -0.0600 | |
| Courbe Coppock: | 2.34 |
| MA7: | 26.35 | |
| MA20: | 26.47 | |
| MA50: | 26.75 | |
| MA100: | 27.71 | |
| MAexp7: | 26.38 | |
| MAexp20: | 26.39 | |
| MAexp50: | 26.79 | |
| MAexp100: | 27.10 | |
| Price / MA7: | -0.19% | |
| Price / MA20: | -0.64% | |
| Price / MA50: | -1.68% | |
| Price / MA100: | -5.09% | |
| Price / MAexp7: | -0.30% | |
| Price / MAexp20: | -0.34% | |
| Price / MAexp50: | -1.83% | |
| Price / MAexp100: | -2.95% |
News
The latest news and videos published on CORBION at the time of the analysis were as follows:
- Olivier Rigaud nominated to succeed Tjerk de Ruiter as CEO of Corbion
- Corbion General Shareholders Meeting approves Supervisory Board reappointments and dividend
- Corbion Q1 2019 Interim Management Statement
- Corbion published AGM agenda
- Corbion to acquire Granotec do Brazil to drive further expansion in food ingredients in Latin America
About author

Online


Add a comment
Comments
0 comments on the analysis CORBION - Daily