| Open: | - |
| Change: | - |
| Volume: | - |
| Low: | - |
| High: | - |
| High / Low range: | - |
| Type: | Futures |
| Ticker: | MYMXXXX |
| ISIN: | MYMXXXX |
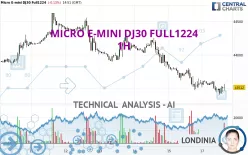
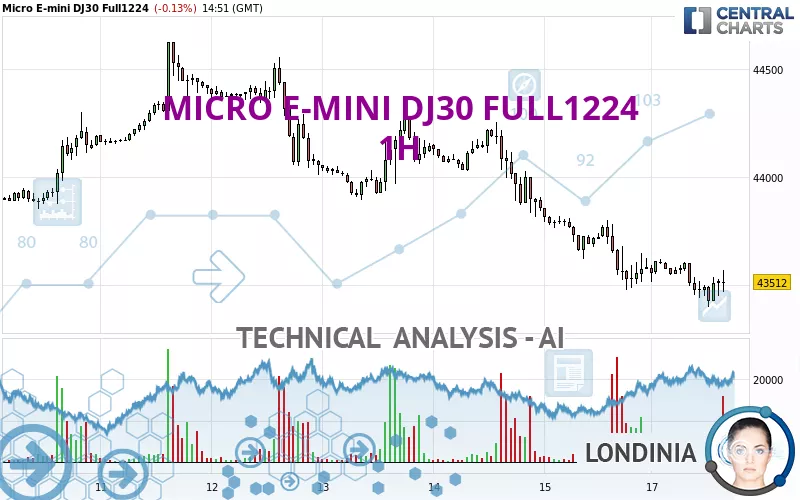
MICRO E-MINI DJ30 FULL0625 - 1H - Technical analysis published on 11/18/2024 (GMT)
- 89
- 0
- 11/18/2024 - 15:01
Click here for a new analysis!
- Timeframe : 1H
- - Analysis generated on 11/18/2024 - 15:01
- Status : LEVEL MAINTAINED
Summary of the analysis

Additional analysis
Quotes
MICRO E-MINI DJ30 FULL1224 rating 43,512 USD. The price registered a decrease of -0.13% on the session and was traded between 43,398 USD and 43,621 USD over the period. The price is currently at +0.26% from its lowest and -0.25% from its highest.A bullish opening was detected by the Central Gaps scanner. Buyers are trying to impose a bullish momentum in the very short term.
Bullish opening
Type : Bullish
Timeframe : Openning
Here is a more detailed summary of the historical variations registered by MICRO E-MINI DJ30 FULL1224:
Near a new HIGH record (5 years)
Type : Bullish
Timeframe : Weekly
Near a new HIGH record (1 year)
Type : Bullish
Timeframe : Weekly
Near a new HIGH record (1st january)
Type : Bullish
Timeframe : Weekly
Near a new LOW record (1 month)
Type : Bearish
Timeframe : Weekly
Technical
A technical analysis in 1H of this MICRO E-MINI DJ30 FULL1224 chart shows a sharp bearish trend. The signals given by moving averages are 89.29% bearish. This strongly bearish trend seems to be slowing down given the slightly bearish signals being given by short-term moving averages. The Central Indicators market scanner currently does not detect any result that concerns moving averages.
An assessment of technical indicators does not currently provide any relevant information to suggest whether the signal given by the technical indicators is more bullish or bearish.
Central Indicators, the detector scanner for these technical indicators has recently detected several signals:
Parabolic SAR indicator bullish reversal
Type : Bullish
Timeframe : 1 hour
Williams %R indicator is back under -50
Type : Bearish
Timeframe : 1 hour
The analysis of the price chart with Central Patterns scanners does not return any result.
Central Candlesticks, the scanner specialised in Japanese candlesticks, detects this inversion signal that could impact the current short-term trend:
Doji
Type : Neutral
Timeframe : 1 hour
| S3 | S2 | S1 | Price | R1 | R2 | R3 | |
|---|---|---|---|---|---|---|---|
| ProTrendLines | 41,453 | 41,924 | 42,417 | 43,512 | 43,518 | 43,801 | 44,020 |
| Change (%) | -4.73% | -3.65% | -2.52% | - | +0.01% | +0.66% | +1.17% |
| Change | -2,059 | -1,588 | -1,095 | - | +6 | +289 | +508 |
| Level | Major | Intermediate | Minor | - | Major | Intermediate | Major |
Pivot points can also be used to set your price objectives. Here is the price situation in relation to pivot points:
| Pivot points | S3 | S2 | S1 | PP | R1 | R2 | R3 |
|---|---|---|---|---|---|---|---|
| Standard | 42,964 | 43,221 | 43,394 | 43,651 | 43,824 | 44,081 | 44,254 |
| Camarilla | 43,450 | 43,489 | 43,529 | 43,568 | 43,607 | 43,647 | 43,686 |
| Woodie | 42,923 | 43,200 | 43,353 | 43,630 | 43,783 | 44,060 | 44,213 |
| Fibonacci | 43,221 | 43,385 | 43,486 | 43,651 | 43,815 | 43,916 | 44,081 |
| Pivot points | S3 | S2 | S1 | PP | R1 | R2 | R3 |
|---|---|---|---|---|---|---|---|
| Standard | 42,006 | 42,741 | 43,155 | 43,890 | 44,304 | 45,039 | 45,453 |
| Camarilla | 43,252 | 43,357 | 43,463 | 43,568 | 43,673 | 43,779 | 43,884 |
| Woodie | 41,845 | 42,661 | 42,994 | 43,810 | 44,143 | 44,959 | 45,292 |
| Fibonacci | 42,741 | 43,180 | 43,451 | 43,890 | 44,329 | 44,600 | 45,039 |
| Pivot points | S3 | S2 | S1 | PP | R1 | R2 | R3 |
|---|---|---|---|---|---|---|---|
| Standard | 39,820 | 40,846 | 41,528 | 42,554 | 43,236 | 44,262 | 44,944 |
| Camarilla | 41,739 | 41,896 | 42,052 | 42,209 | 42,366 | 42,522 | 42,679 |
| Woodie | 39,647 | 40,760 | 41,355 | 42,468 | 43,063 | 44,176 | 44,771 |
| Fibonacci | 40,846 | 41,499 | 41,902 | 42,554 | 43,207 | 43,610 | 44,262 |
Numerical data
The following is the status of the technical indicators and moving averages at the time of publication of this technical analysis:
| RSI (14): | 43.00 | |
| MACD (12,26,9): | -59.0000 | |
| Directional Movement: | -12 | |
| AROON (14): | -72 | |
| DEMA (21): | 43,466 | |
| Parabolic SAR (0,02-0,02-0,2): | 43,398 | |
| Elder Ray (13): | 8 | |
| Super Trend (3,10): | 43,661 | |
| Zig ZAG (10): | 43,512 | |
| VORTEX (21): | 1.0000 | |
| Stochastique (14,3,5): | 53.00 | |
| TEMA (21): | 43,486 | |
| Williams %R (14): | -33.00 | |
| Chande Momentum Oscillator (20): | -58 | |
| Repulse (5,40,3): | 0.0000 | |
| ROCnROLL: | 2 | |
| TRIX (15,9): | 0.0000 | |
| Courbe Coppock: | 0.00 |
| MA7: | 43,963 | |
| MA20: | 43,116 | |
| MA50: | 42,750 | |
| MA100: | 41,811 | |
| MAexp7: | 43,504 | |
| MAexp20: | 43,554 | |
| MAexp50: | 43,691 | |
| MAexp100: | 43,786 | |
| Price / MA7: | -1.03% | |
| Price / MA20: | +0.92% | |
| Price / MA50: | +1.78% | |
| Price / MA100: | +4.07% | |
| Price / MAexp7: | +0.02% | |
| Price / MAexp20: | -0.10% | |
| Price / MAexp50: | -0.41% | |
| Price / MAexp100: | -0.63% |
About author

Online


Add a comment
Comments
0 comments on the analysis MICRO E-MINI DJ30 FULL0625 - 1H