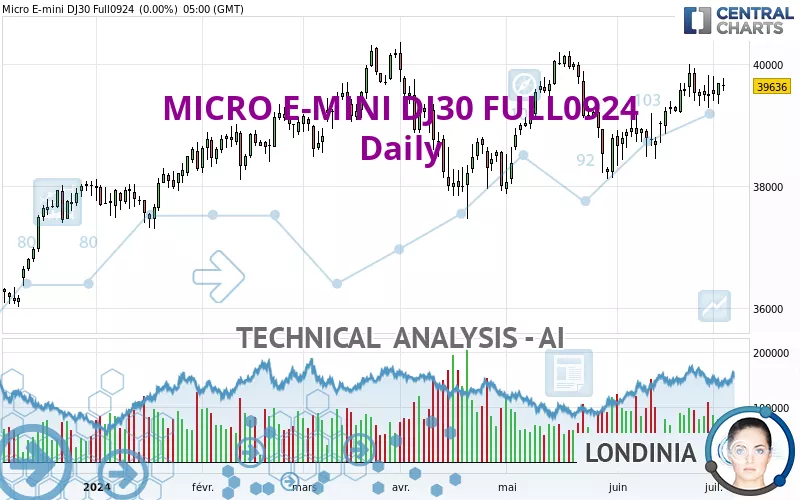
MICRO E-MINI DJ30 FULL0325 - Daily - Technical analysis published on 07/05/2024 (GMT)
- 136
- 0
Click here for a new analysis!
- Timeframe : Daily
- - Analysis generated on
- Status : TARGET REACHED

Summary of the analysis

Additional analysis
Quotes
The MICRO E-MINI DJ30 FULL0924 price is 39,674 USD. On the day, this instrument gained +0.10% with the lowest point at 39,646 USD and the highest point at 39,693 USD. The deviation from the price is +0.07% for the low point and -0.05% for the high point.A study of price movements over other periods shows the following variations:
Near a new HIGH record (5 years)
Type : Bullish
Timeframe : Weekly
Near a new HIGH record (1 year)
Type : Bullish
Timeframe : Weekly
Near a new LOW record (1st january)
Type : Bearish
Timeframe : Weekly
Near a new LOW record (1 month)
Type : Bearish
Timeframe : Weekly
Technical
A technical analysis in Daily of this MICRO E-MINI DJ30 FULL0924 chart shows a bullish trend. 71.43% of the signals given by moving averages are bullish. The overall trend is reinforced by the strong bullish signals from short-term moving averages. The Central Indicators scanner detects a bullish signal on moving averages that could impact this trend:
Moving Average bullish crossovers : AMA20 & AMA50
Type : Bullish
Timeframe : Daily
The probability of a further increase are moderate given the direction of the technical indicators.
Central Indicators, the detector scanner for these technical indicators recently detected a signal:
Price is back over the pivot point
Type : Bullish
Timeframe : Weekly
No signals are given by Central Patterns, a market scanner specialised in chart patterns, resistances and supports.
The Central Candlesticks scanner, specialised in Japanese candlesticks, did not identify any signals.
| S3 | S2 | S1 | Price | R1 | R2 | |
|---|---|---|---|---|---|---|
| ProTrendLines | 35,356 | 37,231 | 38,423 | 39,674 | 40,040 | 40,598 |
| Change (%) | -10.88% | -6.16% | -3.15% | - | +0.92% | +2.33% |
| Change | -4,318 | -2,443 | -1,251 | - | +366 | +924 |
| Level | Minor | Major | Major | - | Intermediate | Major |
Pivot points can also be used to set your price objectives. Here is the price situation in relation to pivot points:
| Pivot points | S3 | S2 | S1 | PP | R1 | R2 | R3 |
|---|---|---|---|---|---|---|---|
| Standard | 39,442 | 39,532 | 39,600 | 39,690 | 39,758 | 39,848 | 39,916 |
| Camarilla | 39,625 | 39,639 | 39,654 | 39,668 | 39,682 | 39,697 | 39,711 |
| Woodie | 39,431 | 39,527 | 39,589 | 39,685 | 39,747 | 39,843 | 39,905 |
| Fibonacci | 39,532 | 39,592 | 39,630 | 39,690 | 39,750 | 39,788 | 39,848 |
| Pivot points | S3 | S2 | S1 | PP | R1 | R2 | R3 |
|---|---|---|---|---|---|---|---|
| Standard | 38,454 | 38,869 | 39,169 | 39,584 | 39,884 | 40,299 | 40,599 |
| Camarilla | 39,272 | 39,338 | 39,403 | 39,469 | 39,535 | 39,600 | 39,666 |
| Woodie | 38,397 | 38,840 | 39,112 | 39,555 | 39,827 | 40,270 | 40,542 |
| Fibonacci | 38,869 | 39,142 | 39,311 | 39,584 | 39,857 | 40,026 | 40,299 |
| Pivot points | S3 | S2 | S1 | PP | R1 | R2 | R3 |
|---|---|---|---|---|---|---|---|
| Standard | 37,505 | 38,102 | 38,806 | 39,403 | 40,107 | 40,704 | 41,408 |
| Camarilla | 39,153 | 39,272 | 39,392 | 39,511 | 39,630 | 39,750 | 39,869 |
| Woodie | 37,560 | 38,129 | 38,861 | 39,430 | 40,162 | 40,731 | 41,463 |
| Fibonacci | 38,102 | 38,599 | 38,906 | 39,403 | 39,900 | 40,207 | 40,704 |
Numerical data
The following is the status of the technical indicators and moving averages at the time of publication of this technical analysis:
| RSI (14): | 56.00 | |
| MACD (12,26,9): | 70.0000 | |
| Directional Movement: | 8 | |
| AROON (14): | 36 | |
| DEMA (21): | 39,588 | |
| Parabolic SAR (0,02-0,02-0,2): | 39,125 | |
| Elder Ray (13): | 112 | |
| Super Trend (3,10): | 38,718 | |
| Zig ZAG (10): | 39,676 | |
| VORTEX (21): | 1.0000 | |
| Stochastique (14,3,5): | 68.00 | |
| TEMA (21): | 39,660 | |
| Williams %R (14): | -39.00 | |
| Chande Momentum Oscillator (20): | 454 | |
| Repulse (5,40,3): | 0.0000 | |
| ROCnROLL: | 1 | |
| TRIX (15,9): | 0.0000 | |
| Courbe Coppock: | 2.00 |
| MA7: | 39,600 | |
| MA20: | 39,440 | |
| MA50: | 39,490 | |
| MA100: | 39,534 | |
| MAexp7: | 39,617 | |
| MAexp20: | 39,515 | |
| MAexp50: | 39,460 | |
| MAexp100: | 39,267 | |
| Price / MA7: | +0.19% | |
| Price / MA20: | +0.59% | |
| Price / MA50: | +0.47% | |
| Price / MA100: | +0.35% | |
| Price / MAexp7: | +0.14% | |
| Price / MAexp20: | +0.40% | |
| Price / MAexp50: | +0.54% | |
| Price / MAexp100: | +1.04% |
About author

Online


Add a comment
Comments
0 comments on the analysis MICRO E-MINI DJ30 FULL0325 - Daily