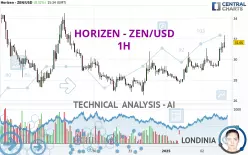
HORIZEN - ZEN/USD - 1H - Technical analysis published on 01/02/2025 (GMT)
- 110
- 0
Click here for a new analysis!
- Timeframe : 1H
- - Analysis generated on
- Status : INVALID

Summary of the analysis

Additional analysis
Quotes
The HORIZEN - ZEN/USD price is 31.65 USD. The price has increased by +8.32% since the last closing and was traded between 28.87 USD and 32.32 USD over the period. The price is currently at +9.63% from its lowest and -2.07% from its highest.The Central Gaps scanner detects a bearish opening. A small advantage for sellers in the very short term.
Bearish opening
Type : Bearish
Timeframe : Openning
So that you have an overall view of the price change, here is a table showing the variations over several periods:
New HIGH record (1st january)
Type : Bullish
Timeframe : Weekly
The Central Volumes scanner notes the presence of abnormal volumes:
Abnormal volumes
Timeframe : 5 days
Abnormal volumes
Timeframe : 20 days
Abnormal volumes
Timeframe : 50 days
Technical
Technical analysis of this 1H chart of HORIZEN - ZEN/USD indicates that the overall trend is strongly bullish. 89.29% of the signals given by moving averages are bullish. This strongly bullish trend is supported by the strong bullish signals given by short-term moving averages. There is no crossing of moving average by the price or crossing of moving averages between themselves.
In fact, 17 technical indicators on 18 studied are currently positioned bullish. Caution: the Central Indicators scanner currently detects an excess:
RSI indicator is overbought : over 70
Type : Neutral
Timeframe : 1 hour
CCI indicator is overbought : over 100
Type : Neutral
Timeframe : 1 hour
Williams %R indicator is overbought : over -20
Type : Neutral
Timeframe : 1 hour
Pivot points : price is over resistance 1
Type : Neutral
Timeframe : 1 hour
The analysis of the price chart with Central Patterns scanners does not return any result.
No result was found by the Central Candlesticks scanner on Japanese candlesticks.
| S3 | S2 | S1 | Price | R1 | R2 | R3 | |
|---|---|---|---|---|---|---|---|
| ProTrendLines | 21.89 | 27.59 | 30.78 | 31.65 | 39.00 | 42.15 | 46.37 |
| Change (%) | -30.84% | -12.83% | -2.75% | - | +23.22% | +33.18% | +46.51% |
| Change | -9.76 | -4.06 | -0.87 | - | +7.35 | +10.50 | +14.72 |
| Level | Minor | Intermediate | Major | - | Major | Minor | Minor |
Pivot points can also be used to set your price objectives. Here is the price situation in relation to pivot points:
| Pivot points | S3 | S2 | S1 | PP | R1 | R2 | R3 |
|---|---|---|---|---|---|---|---|
| Standard | 24.46 | 26.03 | 27.62 | 29.19 | 30.78 | 32.35 | 33.94 |
| Camarilla | 28.35 | 28.64 | 28.93 | 29.22 | 29.51 | 29.80 | 30.09 |
| Woodie | 24.48 | 26.04 | 27.64 | 29.20 | 30.80 | 32.36 | 33.96 |
| Fibonacci | 26.03 | 27.23 | 27.98 | 29.19 | 30.39 | 31.14 | 32.35 |
| Pivot points | S3 | S2 | S1 | PP | R1 | R2 | R3 |
|---|---|---|---|---|---|---|---|
| Standard | -3.50 | 11.00 | 20.80 | 35.30 | 45.10 | 59.60 | 69.40 |
| Camarilla | 23.92 | 26.15 | 28.37 | 30.60 | 32.83 | 35.06 | 37.28 |
| Woodie | -5.85 | 9.83 | 18.45 | 34.13 | 42.75 | 58.43 | 67.05 |
| Fibonacci | 11.00 | 20.28 | 26.02 | 35.30 | 44.58 | 50.32 | 59.60 |
| Pivot points | S3 | S2 | S1 | PP | R1 | R2 | R3 |
|---|---|---|---|---|---|---|---|
| Standard | -26.94 | -7.42 | 10.76 | 30.28 | 48.46 | 67.98 | 86.16 |
| Camarilla | 18.57 | 22.03 | 25.48 | 28.94 | 32.40 | 35.85 | 39.31 |
| Woodie | -27.61 | -7.76 | 10.09 | 29.95 | 47.79 | 67.65 | 85.49 |
| Fibonacci | -7.42 | 6.98 | 15.88 | 30.28 | 44.68 | 53.58 | 67.98 |
Numerical data
The following is the status of technical indicators and moving averages registered at the time this technical analysis was created:
| RSI (14): | 73.10 | |
| MACD (12,26,9): | 0.5200 | |
| Directional Movement: | 28.07 | |
| AROON (14): | 85.71 | |
| DEMA (21): | 30.63 | |
| Parabolic SAR (0,02-0,02-0,2): | 29.56 | |
| Elder Ray (13): | 1.00 | |
| Super Trend (3,10): | 29.38 | |
| Zig ZAG (10): | 31.57 | |
| VORTEX (21): | 1.1600 | |
| Stochastique (14,3,5): | 86.58 | |
| TEMA (21): | 31.13 | |
| Williams %R (14): | -3.76 | |
| Chande Momentum Oscillator (20): | 2.17 | |
| Repulse (5,40,3): | 6.3200 | |
| ROCnROLL: | 1 | |
| TRIX (15,9): | 0.1700 | |
| Courbe Coppock: | 8.34 |
| MA7: | 29.60 | |
| MA20: | 26.33 | |
| MA50: | 18.56 | |
| MA100: | 13.27 | |
| MAexp7: | 30.77 | |
| MAexp20: | 30.00 | |
| MAexp50: | 29.44 | |
| MAexp100: | 29.58 | |
| Price / MA7: | +6.93% | |
| Price / MA20: | +20.21% | |
| Price / MA50: | +70.53% | |
| Price / MA100: | +138.51% | |
| Price / MAexp7: | +2.86% | |
| Price / MAexp20: | +5.50% | |
| Price / MAexp50: | +7.51% | |
| Price / MAexp100: | +7.00% |
About author
Online


Add a comment
Comments
0 comments on the analysis HORIZEN - ZEN/USD - 1H