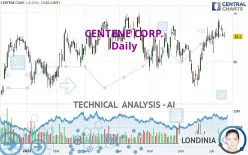
CENTENE CORP. - Daily - Technical analysis published on 07/14/2022 (GMT)
- 274
- 0
Click here for a new analysis!
- Timeframe : Daily
- - Analysis generated on
- Status : TARGET REACHED

Summary of the analysis

Additional analysis
Quotes
CENTENE CORP. rating 85.10 USD. On the day, this instrument lost -0.11% with the lowest point at 84.90 USD and the highest point at 86.14 USD. The deviation from the price is +0.24% for the low point and -1.21% for the high point.The Central Gaps scanner detects a bearish gap which is a sign that the sellers have taken the lead in the very short term.
Opening Gap DOWN
Type : Bearish
Timeframe : Openning
So that you have an overall view of the price change, here is a table showing the variations over several periods:
Near a new HIGH record (5 years)
Type : Bullish
Timeframe : Weekly
Near a new HIGH record (1 year)
Type : Bullish
Timeframe : Weekly
Near a new HIGH record (1st january)
Type : Bullish
Timeframe : Weekly
Near a new HIGH record (1 month)
Type : Bullish
Timeframe : Weekly
Technical
A technical analysis in Daily of this CENTENE CORP. chart shows a strongly bullish trend. 85.71% of the signals given by moving averages are bullish. The overall trend is supported by the strong bullish signals from short-term moving averages. There is no crossing of moving average by the price or crossing of moving averages between themselves.
An assessment of technical indicators shows a slightly bullish signal.
Central Indicators, the scanner specialised in technical indicators, has identified these signals:
Price is back under the pivot point
Type : Bearish
Timeframe : Weekly
Williams %R indicator is back over -50
Type : Bullish
Timeframe : Daily
The Central Patterns scanner, which studies chart patterns, resistances and supports, has identified these signals:
Near horizontal support
Type : Bullish
Timeframe : Daily
Near support of channel
Type : Bullish
Timeframe : Daily
The Central Candlesticks scanner which studies Japanese candlesticks did not detect anything.
| S3 | S2 | S1 | Price | R1 | |
|---|---|---|---|---|---|
| ProTrendLines | 75.52 | 79.06 | 84.75 | 85.10 | 89.01 |
| Change (%) | -11.26% | -7.10% | -0.41% | - | +4.59% |
| Change | -9.58 | -6.04 | -0.35 | - | +3.91 |
| Level | Major | Minor | Major | - | Major |
Attention could also be paid to pivot points to set price objectives:
| Pivot points | S3 | S2 | S1 | PP | R1 | R2 | R3 |
|---|---|---|---|---|---|---|---|
| Standard | 82.92 | 84.02 | 84.60 | 85.70 | 86.28 | 87.38 | 87.96 |
| Camarilla | 84.73 | 84.88 | 85.04 | 85.19 | 85.34 | 85.50 | 85.65 |
| Woodie | 82.67 | 83.89 | 84.35 | 85.57 | 86.03 | 87.25 | 87.71 |
| Fibonacci | 84.02 | 84.66 | 85.06 | 85.70 | 86.34 | 86.74 | 87.38 |
| Pivot points | S3 | S2 | S1 | PP | R1 | R2 | R3 |
|---|---|---|---|---|---|---|---|
| Standard | 76.56 | 79.16 | 83.58 | 86.18 | 90.60 | 93.20 | 97.62 |
| Camarilla | 86.08 | 86.72 | 87.37 | 88.01 | 88.65 | 89.30 | 89.94 |
| Woodie | 77.48 | 79.62 | 84.50 | 86.64 | 91.52 | 93.66 | 98.54 |
| Fibonacci | 79.16 | 81.84 | 83.50 | 86.18 | 88.86 | 90.52 | 93.20 |
| Pivot points | S3 | S2 | S1 | PP | R1 | R2 | R3 |
|---|---|---|---|---|---|---|---|
| Standard | 65.20 | 70.03 | 77.32 | 82.15 | 89.44 | 94.27 | 101.56 |
| Camarilla | 81.28 | 82.39 | 83.50 | 84.61 | 85.72 | 86.83 | 87.94 |
| Woodie | 66.43 | 70.65 | 78.55 | 82.77 | 90.67 | 94.89 | 102.79 |
| Fibonacci | 70.03 | 74.66 | 77.52 | 82.15 | 86.78 | 89.64 | 94.27 |
Numerical data
The following is the status of technical indicators and moving averages registered at the time this technical analysis was created:
| RSI (14): | 53.55 | |
| MACD (12,26,9): | 1.2100 | |
| Directional Movement: | 5.76 | |
| AROON (14): | 21.43 | |
| DEMA (21): | 85.91 | |
| Parabolic SAR (0,02-0,02-0,2): | 84.85 | |
| Elder Ray (13): | 0.32 | |
| Super Trend (3,10): | 79.94 | |
| Zig ZAG (10): | 85.18 | |
| VORTEX (21): | 1.1300 | |
| Stochastique (14,3,5): | 59.05 | |
| TEMA (21): | 86.98 | |
| Williams %R (14): | -48.79 | |
| Chande Momentum Oscillator (20): | 0.77 | |
| Repulse (5,40,3): | -0.1000 | |
| ROCnROLL: | 1 | |
| TRIX (15,9): | 0.1800 | |
| Courbe Coppock: | 13.56 |
| MA7: | 86.28 | |
| MA20: | 83.64 | |
| MA50: | 82.79 | |
| MA100: | 83.71 | |
| MAexp7: | 85.84 | |
| MAexp20: | 84.46 | |
| MAexp50: | 83.46 | |
| MAexp100: | 82.48 | |
| Price / MA7: | -1.37% | |
| Price / MA20: | +1.75% | |
| Price / MA50: | +2.79% | |
| Price / MA100: | +1.66% | |
| Price / MAexp7: | -0.86% | |
| Price / MAexp20: | +0.76% | |
| Price / MAexp50: | +1.97% | |
| Price / MAexp100: | +3.18% |
News
Don't forget to follow the news on CENTENE CORP.. At the time of publication of this analysis, the latest news was as follows:
- CENTENE COMPLETES DIVESTITURE OF PANTHERX RARE
- CENTENE'S DELAWARE SUBSIDIARY AWARDED STATEWIDE MEDICAID CONTRACT
- Thinking about trading options or stock in Nvidia, Centene, McKesson, Humana, or Alibaba?
- CENTENE CORPORATION SCHEDULES 2022 SECOND QUARTER FINANCIAL RESULTS CONFERENCE CALL
- Thinking about trading options or stock in Centene Corp, Humana, United Airlines, Devon Energy, or Freeport-McMoRan?
About author
Online


Add a comment
Comments
0 comments on the analysis CENTENE CORP. - Daily