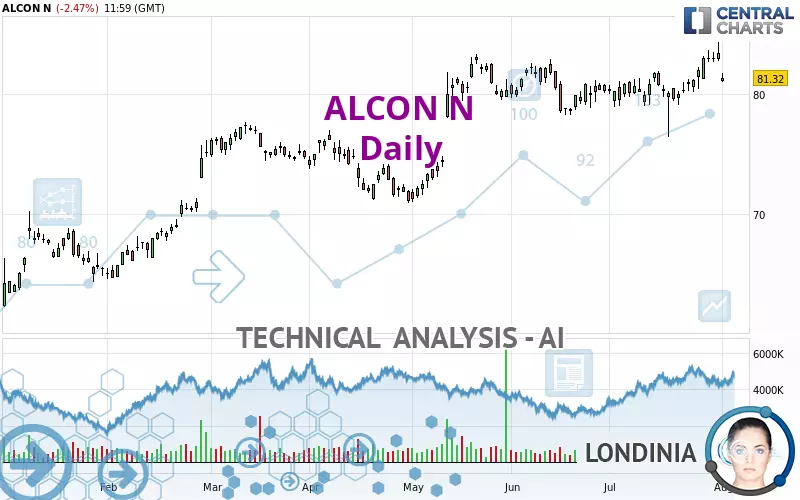
ALCON N - Daily - Technical analysis published on 02/26/2025 (GMT)
- 57
- 0
Click here for a new analysis!
- Timeframe : Daily
- - Analysis generated on
- Status : INVALID

Summary of the analysis

Additional analysis
Quotes
The ALCON N rating is 84.88 CHF. On the day, this instrument gained +5.89% with the lowest point at 83.02 CHF and the highest point at 87.00 CHF. The deviation from the price is +2.24% for the low point and -2.44% for the high point.The Central Gaps scanner detects a bullish gap which is a sign that buyers have taken the lead in the very short term.
Opening Gap UP
Type : Bullish
Timeframe : Openning
A study of price movements over other periods shows the following variations:
New HIGH record (5 years)
Type : Bullish
Timeframe : Weekly
New HIGH record (1 year)
Type : Bullish
Timeframe : Weekly
New HIGH record (1st january)
Type : Bullish
Timeframe : Weekly
New HIGH record (1 month)
Type : Bullish
Timeframe : Weekly
Technical
Technical analysis of ALCON N in Daily shows a strongly overall bullish trend. 89.29% of the signals given by moving averages are bullish. The overall trend is supported by the strong bullish signals from short-term moving averages. The Central Indicators market scanner is currently detecting several bullish signals that could impact this trend:
Bullish price crossover with Moving Average 20
Type : Bullish
Timeframe : Daily
Bullish price crossover with adaptative moving average 20
Type : Bullish
Timeframe : Daily
Bullish price crossover with adaptative moving average 100
Type : Bullish
Timeframe : Daily
In fact, according to the parameters integrated into the Central Analyzer system, 11 technical indicators out of 18 analysed are currently bullish. Caution: the Central Indicators scanner currently detects an excess:
CCI indicator is overbought : over 100
Type : Neutral
Timeframe : Daily
CCI indicator: bullish divergence
Type : Bullish
Timeframe : Daily
Pivot points : price is over resistance 2
Type : Neutral
Timeframe : Weekly
Pivot points : price is over resistance 3
Type : Neutral
Timeframe : Daily
RSI indicator is back over 50
Type : Bullish
Timeframe : Daily
Parabolic SAR indicator bullish reversal
Type : Bullish
Timeframe : Daily
Aroon indicator bullish trend
Type : Bullish
Timeframe : Daily
Momentum indicator is back over 0
Type : Bullish
Timeframe : Daily
Williams %R indicator is back over -50
Type : Bullish
Timeframe : Daily
Central Patterns, the market scanner focusing on chart patterns, resistances and supports found these results:
Horizontal resistance is broken
Type : Bullish
Timeframe : Daily
Resistance of channel is broken
Type : Bullish
Timeframe : Daily
Central Candlesticks, the scanner specialised in Japanese candlesticks, detects these bearish signals that could support the hypothesis of a small drop in the very short term:
Black line without upper shadow
Type : Bearish
Timeframe : Daily
Long black line
Type : Bearish
Timeframe : Daily
| S3 | S2 | S1 | Price | |
|---|---|---|---|---|
| ProTrendLines | 81.64 | 83.38 | 84.68 | 84.88 |
| Change (%) | -3.82% | -1.77% | -0.24% | - |
| Change | -3.24 | -1.50 | -0.20 | - |
| Level | Intermediate | Major | Major | - |
To determine price objectives, it is also possible to use the pivot points. Here is the price position in relation to pivot points:
| Pivot points | S3 | S2 | S1 | PP | R1 | R2 | R3 |
|---|---|---|---|---|---|---|---|
| Standard | 78.36 | 79.20 | 79.68 | 80.52 | 81.00 | 81.84 | 82.32 |
| Camarilla | 79.80 | 79.92 | 80.04 | 80.16 | 80.28 | 80.40 | 80.52 |
| Woodie | 78.18 | 79.11 | 79.50 | 80.43 | 80.82 | 81.75 | 82.14 |
| Fibonacci | 79.20 | 79.70 | 80.02 | 80.52 | 81.02 | 81.34 | 81.84 |
| Pivot points | S3 | S2 | S1 | PP | R1 | R2 | R3 |
|---|---|---|---|---|---|---|---|
| Standard | 77.49 | 78.57 | 79.91 | 80.99 | 82.33 | 83.41 | 84.75 |
| Camarilla | 80.58 | 80.80 | 81.02 | 81.24 | 81.46 | 81.68 | 81.91 |
| Woodie | 77.61 | 78.64 | 80.03 | 81.06 | 82.45 | 83.48 | 84.87 |
| Fibonacci | 78.57 | 79.50 | 80.07 | 80.99 | 81.92 | 82.49 | 83.41 |
| Pivot points | S3 | S2 | S1 | PP | R1 | R2 | R3 |
|---|---|---|---|---|---|---|---|
| Standard | 66.40 | 70.04 | 76.88 | 80.52 | 87.36 | 91.00 | 97.84 |
| Camarilla | 80.84 | 81.80 | 82.76 | 83.72 | 84.68 | 85.64 | 86.60 |
| Woodie | 68.00 | 70.84 | 78.48 | 81.32 | 88.96 | 91.80 | 99.44 |
| Fibonacci | 70.04 | 74.04 | 76.52 | 80.52 | 84.52 | 87.00 | 91.00 |
Numerical data
The following are the details of the technical indicators and moving averages that were collected to generate this technical analysis:
| RSI (14): | 65.84 | |
| MACD (12,26,9): | 0.5200 | |
| Directional Movement: | 18.89 | |
| AROON (14): | 28.57 | |
| DEMA (21): | 82.26 | |
| Parabolic SAR (0,02-0,02-0,2): | 79.66 | |
| Elder Ray (13): | 3.33 | |
| Super Trend (3,10): | 79.92 | |
| Zig ZAG (10): | 84.86 | |
| VORTEX (21): | 0.9000 | |
| Stochastique (14,3,5): | 33.77 | |
| TEMA (21): | 82.02 | |
| Williams %R (14): | -28.34 | |
| Chande Momentum Oscillator (20): | 3.24 | |
| Repulse (5,40,3): | -2.7200 | |
| ROCnROLL: | 1 | |
| TRIX (15,9): | 0.1200 | |
| Courbe Coppock: | 3.34 |
| MA7: | 81.40 | |
| MA20: | 82.12 | |
| MA50: | 79.37 | |
| MA100: | 79.57 | |
| MAexp7: | 81.88 | |
| MAexp20: | 81.45 | |
| MAexp50: | 80.37 | |
| MAexp100: | 79.85 | |
| Price / MA7: | +4.28% | |
| Price / MA20: | +3.36% | |
| Price / MA50: | +6.94% | |
| Price / MA100: | +6.67% | |
| Price / MAexp7: | +3.66% | |
| Price / MAexp20: | +4.21% | |
| Price / MAexp50: | +5.61% | |
| Price / MAexp100: | +6.30% |
News
Don't forget to follow the news on ALCON N. At the time of publication of this analysis, the latest news was as follows:
- Alcon Reports Full-Year 2024 Results, with Strong Top-line and Earnings Growth and Record Cash Generation
- Alcon Reports Full-Year 2024 Results, with Strong Top-line and Earnings Growth and Record Cash Generation
- Alcon Announces U.S. Launch of New SYSTANE PRO Preservative-Free, Revolutionizing Dry Eye Relief With Its Longest Lasting Formula Yet
- Alcon Announces U.S. Launch of Voyager DSLT, First-of-its-Kind Treatment for Glaucoma and Ocular Hypertension
- Alcon to Present at 2025 Annual J.P. Morgan Healthcare Conference
About author
Online


Add a comment
Comments
0 comments on the analysis ALCON N - Daily