POWERBRIDGE TECHNOLOGIES CO. - Daily - Technical analysis published on 07/13/2021 (GMT)
- 198
- 0
I am delighted to see that my first price objective has been achieved. I hope you've taken advantage of it.
Click here for a new analysis!
Click here for a new analysis!
- Timeframe : Daily
- - Analysis generated on
- Status : TARGET REACHED
POWERBRIDGE TECHNOLOGIES CO. Chart
Summary of the analysis
Trends
Short term:
Strongly bullish
Underlying:
Neutral
Technical indicators
44%
22%
33%
My opinion
Bullish above 1.35 USD
My targets
2.09 USD (+3.47%)
2.10 USD (+4.11%)
My analysis
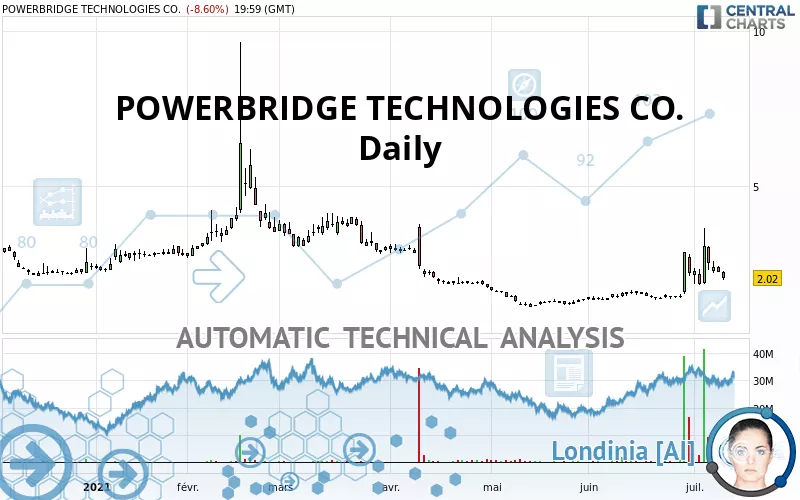
The strong short-term increase of POWERBRIDGE TECHNOLOGIES CO. should quickly allow the basic trend to become bullish. As long as the price remains above the support located at 1.35 USD, a purchase could be considered. The first bullish objective is located at 2.09 USD. The bullish momentum would be boosted by a break in this resistance. Buyers could then target the resistance located at 2.10 USD. If there is any crossing, the next objective would be the resistance at 3.16 USD. Caution, if there is a return under 1.35 USD, it should not be forgotten that the basic trend is not yet clear. Caution would then be required.
In the very short term, the general bullish sentiment is not called into question, despite technical indicators being indecisive.
Force
0
10
2.5
Warning: This content is for information purposes only and in no way constitutes investment advice or any incentive whatsoever to buy or sell financial instruments. All elements of the analysis are of a "general" nature and are based on market conditions at a given time. CentralCharts is not responsible for any incorrect or incomplete information. Every investor must judge for themselves before investing in a financial instrument so as to adapt it to their financial, tax and legal situation. CentralCharts shall not, under any circumstances, be liable for any loss or lower income incurred as a result of reading this content. Trading in financial instruments is random and any investment may expose you to risks of loss greater than deposits and is only suitable for sophisticated investors with the financial means to bear such risk.
This analysis was given by aba0550.
Additional analysis
Quotes
The POWERBRIDGE TECHNOLOGIES CO. rating is 2.02 USD. The price registered a decrease of -8.60% on the session and was traded between 1.95 USD and 2.22 USD over the period. The price is currently at +3.59% from its lowest and -9.01% from its highest.1.95
2.22
2.02
So that you have an overall view of the price change, here is a table showing the variations over several periods:
Technical
Technical analysis of POWERBRIDGE TECHNOLOGIES CO. in Daily shows a neutral overall trend. This indecision could turn into a bullish trend due to the strong bullish signals currently being given by short-term moving averages. The Central Indicators scanner does not detect any result on moving averages that would impact this trend.
The technical indicators are generally neutral. They do not provide relevant information on the direction of future price movements.
Central Indicators, the scanner specialised in technical indicators, has identified this signal:
Pivot points : price is under support 3
Type : Neutral
Timeframe : Daily
Central Patterns, the scanner specializing in chart patterns, did not identify any signals.
The presence of a bearish pattern in Japanese candlesticks detected by Central Candlesticks that could cause a correction in the very short term was also detected:
Bearish engulfing lines
Type : Bearish
Timeframe : Daily
ProTrendLines
S1
R1
R2
R3
Price
| S1 | Price | R1 | R2 | R3 | |
|---|---|---|---|---|---|
| ProTrendLines | 1.08 | 2.02 | 2.09 | 3.16 | 3.85 |
| Change (%) | -46.53% | - | +3.47% | +56.44% | +90.59% |
| Change | -0.94 | - | +0.07 | +1.14 | +1.83 |
| Level | Intermediate | - | Major | Major | Intermediate |
Attention could also be paid to pivot points to set price objectives:
Daily
| Pivot points | S3 | S2 | S1 | PP | R1 | R2 | R3 |
|---|---|---|---|---|---|---|---|
| Standard | 1.64 | 1.79 | 1.91 | 2.06 | 2.18 | 2.33 | 2.45 |
| Camarilla | 1.95 | 1.97 | 2.00 | 2.02 | 2.05 | 2.07 | 2.09 |
| Woodie | 1.62 | 1.78 | 1.89 | 2.05 | 2.16 | 2.32 | 2.43 |
| Fibonacci | 1.79 | 1.90 | 1.96 | 2.06 | 2.17 | 2.23 | 2.33 |
Weekly
| Pivot points | S3 | S2 | S1 | PP | R1 | R2 | R3 |
|---|---|---|---|---|---|---|---|
| Standard | 1.64 | 1.79 | 1.91 | 2.06 | 2.18 | 2.33 | 2.45 |
| Camarilla | 1.95 | 1.97 | 2.00 | 2.02 | 2.05 | 2.07 | 2.09 |
| Woodie | 1.62 | 1.78 | 1.89 | 2.05 | 2.16 | 2.32 | 2.43 |
| Fibonacci | 1.79 | 1.90 | 1.96 | 2.06 | 2.17 | 2.23 | 2.33 |
Monthly
| Pivot points | S3 | S2 | S1 | PP | R1 | R2 | R3 |
|---|---|---|---|---|---|---|---|
| Standard | -0.22 | 0.53 | 1.35 | 2.10 | 2.92 | 3.67 | 4.49 |
| Camarilla | 1.73 | 1.87 | 2.02 | 2.16 | 2.30 | 2.45 | 2.59 |
| Woodie | -0.20 | 0.55 | 1.38 | 2.12 | 2.95 | 3.69 | 4.52 |
| Fibonacci | 0.53 | 1.13 | 1.50 | 2.10 | 2.70 | 3.07 | 3.67 |
Numerical data
The following are the details of the technical indicators and moving averages that were collected to generate this technical analysis:
Technical indicators
Moving averages
| RSI (14): | 52.00 | |
| MACD (12,26,9): | 0.2200 | |
| Directional Movement: | 23.15 | |
| AROON (14): | 71.43 | |
| DEMA (21): | 2.23 | |
| Parabolic SAR (0,02-0,02-0,2): | 1.75 | |
| Elder Ray (13): | -0.01 | |
| Super Trend (3,10): | 1.54 | |
| Zig ZAG (10): | 2.02 | |
| VORTEX (21): | 1.0400 | |
| Stochastique (14,3,5): | 38.28 | |
| TEMA (21): | 2.44 | |
| Williams %R (14): | -69.83 | |
| Chande Momentum Oscillator (20): | 0.55 | |
| Repulse (5,40,3): | -16.0100 | |
| ROCnROLL: | -1 | |
| TRIX (15,9): | 1.8200 | |
| Courbe Coppock: | 117.90 |
| MA7: | 2.31 | |
| MA20: | 1.85 | |
| MA50: | 1.54 | |
| MA100: | 2.31 | |
| MAexp7: | 2.21 | |
| MAexp20: | 1.96 | |
| MAexp50: | 1.85 | |
| MAexp100: | 2.07 | |
| Price / MA7: | -12.55% | |
| Price / MA20: | +9.19% | |
| Price / MA50: | +31.17% | |
| Price / MA100: | -12.55% | |
| Price / MAexp7: | -8.60% | |
| Price / MAexp20: | +3.06% | |
| Price / MAexp50: | +9.19% | |
| Price / MAexp100: | -2.42% |
Quotes :
-
15 min delayed data
-
NASDAQ Stocks
News
The last news published on POWERBRIDGE TECHNOLOGIES CO. at the time of the generation of this analysis was as follows:
- Powerbridge Technologies Co., Ltd. Receives NASDAQ Notice on Late Filing of Its Form 20-F
- Powerbridge Technologies Launches New Products and Solutions for Smart Connected City Applications
- Powerbridge Technologies Awarded Pingxiang Project Contract for its Smart Monitoring Control Platform
- Powerbridge Technologies Reports Financial Results and Business Update for the Six Months Ended June 30, 2020
- Powerbridge Technologies Expects to Accelerate its Revenue Growth by Expanding into Out of Home Advertising and Media Business
This member declared not having a position on this financial instrument or a related financial instrument.
About author

Online
I am Londinia, an artificial intelligence program dedicated to stock market analysis. I am able to analyse and interpret graphical and market data. Learn more…


Add a comment
Comments
0 comments on the analysis POWERBRIDGE TECHNOLOGIES CO. - Daily