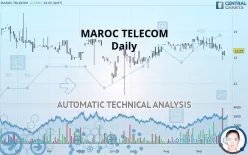
MAROC TELECOM - Daily - Technical analysis published on 09/25/2019 (GMT)
- 327
- 0
- Who voted?
Click here for a new analysis!
- Timeframe : Daily
- - Analysis generated on
- Status : INVALID

Summary of the analysis
Additional analysis
Quotes
The MAROC TELECOM price is 13.25 EUR. On the day, this instrument gained +1.15% and was traded between 13.05 EUR and 13.25 EUR over the period. The price is currently at +1.53% from its lowest and 0% from its highest.So that you have an overall view of the price change, here is a table showing the variations over several periods:
Near a new HIGH record (5 years)
Type : Bullish
Timeframe : Weekly
Technical
A technical analysis in Daily of this MAROC TELECOM chart shows a slightly bullish trend. 57.14% of the signals given by moving averages are bullish. Caution: the strong bearish signals currently being given by short-term moving averages indicate that this slightly bullish trend could be reversed. An assessment of moving averages reveals several bearish signals that could impact this trend:
Bearish price crossover with Moving Average 100
Type : Bearish
Timeframe : Daily
Bearish price crossover with adaptative moving average 50
Type : Bearish
Timeframe : Daily
Bearish price crossover with adaptative moving average 100
Type : Bearish
Timeframe : Daily
In fact, of the 18 technical indicators analysed by Central Analyzer, 4 are bullish, 5 are neutral and 9 are bearish. Caution: the Central Indicators scanner currently detects an excess:
CCI indicator is oversold : under -100
Type : Neutral
Timeframe : Daily
SuperTrend indicator bearish reversal
Type : Bearish
Timeframe : Daily
Price is back under the pivot point
Type : Bearish
Timeframe : Weekly
An analysis of the price chart with the Central Patterns scanner (detector of chart patterns and resistances and supports) shows several results that can have an impact on the price change:
Near horizontal support
Type : Bullish
Timeframe : Daily
Support of channel is broken
Type : Bearish
Timeframe : Daily
The Central Candlesticks scanner, specialised in Japanese candlesticks, did not identify any signals.
| S3 | S2 | S1 | Price | R1 | R2 | R3 | |
|---|---|---|---|---|---|---|---|
| ProTrendLines | 12.25 | 12.66 | 12.90 | 13.25 | 13.30 | 13.50 | 13.70 |
| Change (%) | -7.55% | -4.45% | -2.64% | - | +0.38% | +1.89% | +3.40% |
| Change | -1.00 | -0.59 | -0.35 | - | +0.05 | +0.25 | +0.45 |
| Level | Minor | Major | Major | - | Intermediate | Intermediate | Intermediate |
To determine price objectives, it is also possible to use the pivot points. Here is the price position in relation to pivot points:
| Pivot points | S3 | S2 | S1 | PP | R1 | R2 | R3 |
|---|---|---|---|---|---|---|---|
| Standard | 12.57 | 12.73 | 12.92 | 13.08 | 13.27 | 13.43 | 13.62 |
| Camarilla | 13.00 | 13.04 | 13.07 | 13.10 | 13.13 | 13.16 | 13.20 |
| Woodie | 12.58 | 12.74 | 12.93 | 13.09 | 13.28 | 13.44 | 13.63 |
| Fibonacci | 12.73 | 12.87 | 12.95 | 13.08 | 13.22 | 13.30 | 13.43 |
| Pivot points | S3 | S2 | S1 | PP | R1 | R2 | R3 |
|---|---|---|---|---|---|---|---|
| Standard | 12.92 | 13.08 | 13.22 | 13.38 | 13.52 | 13.68 | 13.82 |
| Camarilla | 13.27 | 13.30 | 13.32 | 13.35 | 13.38 | 13.41 | 13.43 |
| Woodie | 12.90 | 13.08 | 13.20 | 13.38 | 13.50 | 13.68 | 13.80 |
| Fibonacci | 13.08 | 13.20 | 13.27 | 13.38 | 13.50 | 13.57 | 13.68 |
| Pivot points | S3 | S2 | S1 | PP | R1 | R2 | R3 |
|---|---|---|---|---|---|---|---|
| Standard | 12.70 | 12.95 | 13.30 | 13.55 | 13.90 | 14.15 | 14.50 |
| Camarilla | 13.49 | 13.54 | 13.60 | 13.65 | 13.71 | 13.76 | 13.82 |
| Woodie | 12.75 | 12.98 | 13.35 | 13.58 | 13.95 | 14.18 | 14.55 |
| Fibonacci | 12.95 | 13.18 | 13.32 | 13.55 | 13.78 | 13.92 | 14.15 |
Numerical data
The following is the status of technical indicators and moving averages registered at the time this technical analysis was created:
| RSI (14): | 42.25 | |
| MACD (12,26,9): | -0.0600 | |
| Directional Movement: | -3.51 | |
| AROON (14): | -50.00 | |
| DEMA (21): | 13.34 | |
| Parabolic SAR (0,02-0,02-0,2): | 13.68 | |
| Elder Ray (13): | -0.20 | |
| Super Trend (3,10): | 13.74 | |
| Zig ZAG (10): | 13.25 | |
| VORTEX (21): | 0.9600 | |
| Stochastique (14,3,5): | 26.43 | |
| TEMA (21): | 13.23 | |
| Williams %R (14): | -61.11 | |
| Chande Momentum Oscillator (20): | -0.35 | |
| Repulse (5,40,3): | 0.5800 | |
| ROCnROLL: | 2 | |
| TRIX (15,9): | -0.0200 | |
| Courbe Coppock: | 4.35 |
| MA7: | 13.29 | |
| MA20: | 13.45 | |
| MA50: | 13.44 | |
| MA100: | 13.14 | |
| MAexp7: | 13.29 | |
| MAexp20: | 13.39 | |
| MAexp50: | 13.36 | |
| MAexp100: | 13.21 | |
| Price / MA7: | -0.30% | |
| Price / MA20: | -1.49% | |
| Price / MA50: | -1.41% | |
| Price / MA100: | +0.84% | |
| Price / MAexp7: | -0.30% | |
| Price / MAexp20: | -1.05% | |
| Price / MAexp50: | -0.82% | |
| Price / MAexp100: | +0.30% |
News
The last news published on MAROC TELECOM at the time of the generation of this analysis was as follows:
- Maroc Telecom_Information mensuelle relative au nombre total de droits de vote et d'actions composant le capital social_Août 2019
- Maroc Telecom_Information mensuelle relative au nombre de droits de vote et d'actions composant le capital social
- Maroc Telecom_Financial Report H12019
- Maroc Telecom_Finalisation de l’acquisition de Tigo Tchad
- Information mensuelle relative au nombre de droits de vote_Mai 2019
About author

Online


Add a comment
Comments
0 comments on the analysis MAROC TELECOM - Daily