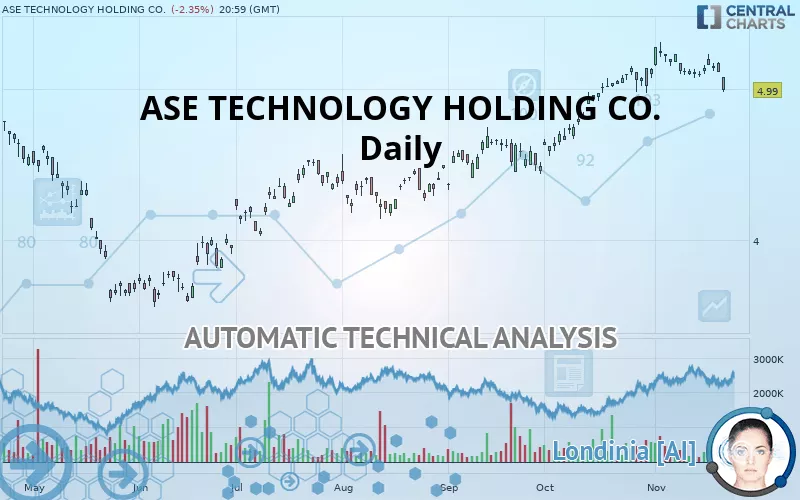
ASE TECHNOLOGY HOLDING CO. - Daily - Technical analysis published on 11/22/2019 (GMT)
- 328
- 0
- Who voted?
Click here for a new analysis!
- Timeframe : Daily
- - Analysis generated on
- Status : INVALID

Summary of the analysis

Additional analysis
Quotes
ASE TECHNOLOGY HOLDING CO. rating 4.99 USD. The price is lower by -2.35% since the last closing with the lowest point at 4.98 USD and the highest point at 5.08 USD. The deviation from the price is +0.20% for the low point and -1.77% for the high point.A bearish gap was detected at the opening by the Central Gaps scanner. There are a lot of sellers and they have the upper hand in the very short term.
Opening Gap DOWN
Type : Bearish
Timeframe : Openning
So that you have an overall view of the price change, here is a table showing the variations over several periods:
Near a new HIGH record (1 year)
Type : Bullish
Timeframe : Weekly
Near a new HIGH record (1st january)
Type : Bullish
Timeframe : Weekly
Technical
Technical analysis of ASE TECHNOLOGY HOLDING CO. in Daily shows an overall bullish trend. 71.43% of the signals given by moving averages are bullish. Caution: the neutral signals currently given by short-term moving averages show us that the global trend is losing momentum. The Central Indicators market scanner is currently detecting several bearish signals that could impact this trend:
Bearish price crossover with Moving Average 20
Type : Bearish
Timeframe : Daily
Bearish price crossover with adaptative moving average 20
Type : Bearish
Timeframe : Daily
In fact, of the 18 technical indicators analysed by Central Analyzer, 4 are bullish, 4 are neutral and 10 are bearish. Caution: the Central Indicators scanner currently detects an excess:
Williams %R indicator is oversold : under -80
Type : Neutral
Timeframe : Daily
Pivot points : price is under support 3
Type : Neutral
Timeframe : Daily
Pivot points : price is under support 3
Type : Neutral
Timeframe : Weekly
Price is back over the pivot point
Type : Bullish
Timeframe : Weekly
Central Patterns, the market scanner focusing on chart patterns, resistances and supports found this result:
Horizontal support is broken
Type : Bearish
Timeframe : Daily
No result was found by the Central Candlesticks scanner on Japanese candlesticks.
| S3 | S2 | S1 | Price | R1 | R2 | R3 | |
|---|---|---|---|---|---|---|---|
| ProTrendLines | 4.22 | 4.41 | 4.92 | 4.99 | 5.10 | 5.31 | 5.86 |
| Change (%) | -15.43% | -11.62% | -1.40% | - | +2.20% | +6.41% | +17.43% |
| Change | -0.77 | -0.58 | -0.07 | - | +0.11 | +0.32 | +0.87 |
| Level | Intermediate | Major | Major | - | Minor | Major | Intermediate |
To determine price objectives, it is also possible to use the pivot points. Here is the price position in relation to pivot points:
| Pivot points | S3 | S2 | S1 | PP | R1 | R2 | R3 |
|---|---|---|---|---|---|---|---|
| Standard | 5.02 | 5.06 | 5.09 | 5.13 | 5.16 | 5.20 | 5.23 |
| Camarilla | 5.09 | 5.10 | 5.10 | 5.11 | 5.12 | 5.12 | 5.13 |
| Woodie | 5.01 | 5.06 | 5.08 | 5.13 | 5.15 | 5.20 | 5.22 |
| Fibonacci | 5.06 | 5.09 | 5.11 | 5.13 | 5.16 | 5.18 | 5.20 |
| Pivot points | S3 | S2 | S1 | PP | R1 | R2 | R3 |
|---|---|---|---|---|---|---|---|
| Standard | 5.01 | 5.04 | 5.09 | 5.13 | 5.18 | 5.21 | 5.26 |
| Camarilla | 5.12 | 5.12 | 5.13 | 5.14 | 5.15 | 5.16 | 5.16 |
| Woodie | 5.01 | 5.04 | 5.10 | 5.13 | 5.18 | 5.21 | 5.27 |
| Fibonacci | 5.04 | 5.07 | 5.09 | 5.13 | 5.16 | 5.18 | 5.21 |
| Pivot points | S3 | S2 | S1 | PP | R1 | R2 | R3 |
|---|---|---|---|---|---|---|---|
| Standard | 4.14 | 4.35 | 4.72 | 4.94 | 5.31 | 5.53 | 5.90 |
| Camarilla | 4.94 | 4.99 | 5.05 | 5.10 | 5.15 | 5.21 | 5.26 |
| Woodie | 4.22 | 4.39 | 4.81 | 4.98 | 5.40 | 5.57 | 5.98 |
| Fibonacci | 4.35 | 4.57 | 4.71 | 4.94 | 5.16 | 5.30 | 5.53 |
Numerical data
The following are the details of the technical indicators and moving averages that were collected to generate this technical analysis:
| RSI (14): | 44.52 | |
| MACD (12,26,9): | 0.0500 | |
| Directional Movement: | -1.26 | |
| AROON (14): | -92.86 | |
| DEMA (21): | 5.17 | |
| Parabolic SAR (0,02-0,02-0,2): | 5.31 | |
| Elder Ray (13): | -0.08 | |
| Super Trend (3,10): | 4.97 | |
| Zig ZAG (10): | 4.99 | |
| VORTEX (21): | 0.8600 | |
| Stochastique (14,3,5): | 15.70 | |
| TEMA (21): | 5.12 | |
| Williams %R (14): | -96.97 | |
| Chande Momentum Oscillator (20): | -0.23 | |
| Repulse (5,40,3): | -3.7800 | |
| ROCnROLL: | -1 | |
| TRIX (15,9): | 0.2400 | |
| Courbe Coppock: | 1.30 |
| MA7: | 5.11 | |
| MA20: | 5.13 | |
| MA50: | 4.90 | |
| MA100: | 4.60 | |
| MAexp7: | 5.10 | |
| MAexp20: | 5.09 | |
| MAexp50: | 4.92 | |
| MAexp100: | 4.68 | |
| Price / MA7: | -2.35% | |
| Price / MA20: | -2.73% | |
| Price / MA50: | +1.84% | |
| Price / MA100: | +8.48% | |
| Price / MAexp7: | -2.16% | |
| Price / MAexp20: | -1.96% | |
| Price / MAexp50: | +1.42% | |
| Price / MAexp100: | +6.62% |
News
Don"t forget to follow the news on ASE TECHNOLOGY HOLDING CO.. At the time of publication of this analysis, the latest news was as follows:
- Advanced Semiconductor Engineering, Inc. Reports Unaudited Consolidated Financial Results For The First Quarter of 2018
- Advanced Semiconductor Engineering, Inc. Announces Monthly Net Revenues
- Advanced Semiconductor Engineering, Inc. Files 2017 Annual Report on Form 20-F
- Advanced Semiconductor Engineering, Inc. Announces Monthly Net Revenues
- Advanced Semiconductor Engineering, Inc. Announces Monthly Net Revenues
About author

Online


Add a comment
Comments
0 comments on the analysis ASE TECHNOLOGY HOLDING CO. - Daily