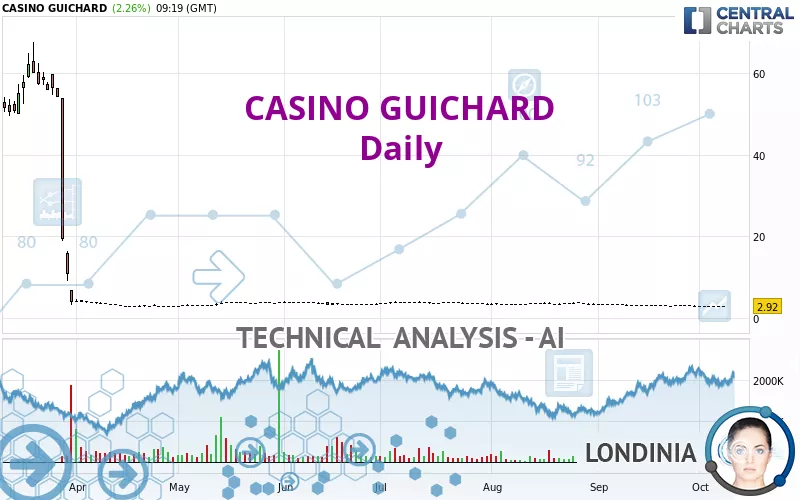
CASINO GUICHARD - Daily - Technical analysis published on 10/08/2024 (GMT)
- 128
- 0
Click here for a new analysis!
- Timeframe : Daily
- - Analysis generated on
- Status : TARGET REACHED

Summary of the analysis

Additional analysis
Quotes
CASINO GUICHARD rating 2.9200 EUR. The price has increased by +2.26% since the last closing and was between 2.8145 EUR and 2.9200 EUR. This implies that the price is at +3.75% from its lowest and at 0% from its highest.So that you have an overall view of the price change, here is a table showing the variations over several periods:
Near a new LOW record (5 years)
Type : Bearish
Timeframe : Weekly
Near a new LOW record (1 year)
Type : Bearish
Timeframe : Weekly
Near a new LOW record (1st january)
Type : Bearish
Timeframe : Weekly
New LOW record (1 month)
Type : Bearish
Timeframe : Weekly
Technical
Technical analysis of CASINO GUICHARD in Daily shows a overall strongly bearish trend. The signals given by moving averages are 92.86% bearish. This strong bearish trend is confirmed by the strong signals currently being given by short-term moving averages. There is no crossing of moving average by the price or crossing of moving averages between themselves.
In fact, of the 18 technical indicators analysed by Central Analyzer, 5 are bullish, 3 are neutral and 10 are bearish. But beware of excesses. The Central Indicators scanner currently detects this:
MACD indicator: bullish divergence
Type : Bullish
Timeframe : Daily
Pivot points : price is over resistance 1
Type : Neutral
Timeframe : Daily
Price is back over the pivot point
Type : Bullish
Timeframe : Weekly
Central Patterns, the market scanner focusing on chart patterns, resistances and supports found this result:
Near horizontal support
Type : Bullish
Timeframe : Daily
Central Candlesticks, the scanner specialised in Japanese candlesticks, detects these signals that could have an impact on the current short-term trend:
White hanging man / hammer
Type : Neutral
Timeframe : Daily
Dragon-fly doji
Type : Bullish
Timeframe : Daily
Doji
Type : Neutral
Timeframe : Daily
| S1 | Price | R1 | R2 | R3 | |
|---|---|---|---|---|---|
| ProTrendLines | 2.8000 | 2.9200 | 39.9200 | 52.5500 | 70.9500 |
| Change (%) | -4.11% | - | +1,267.12% | +1,699.66% | +2,329.79% |
| Change | -0.1200 | - | +37.0000 | +49.6300 | +68.0300 |
| Level | Major | - | Minor | Minor | Major |
Pivot points can also be used to set your price objectives. Here is the price situation in relation to pivot points:
| Pivot points | S3 | S2 | S1 | PP | R1 | R2 | R3 |
|---|---|---|---|---|---|---|---|
| Standard | 2.7395 | 2.7885 | 2.8220 | 2.8710 | 2.9045 | 2.9535 | 2.9870 |
| Camarilla | 2.8328 | 2.8404 | 2.8479 | 2.8555 | 2.8631 | 2.8706 | 2.8782 |
| Woodie | 2.7318 | 2.7846 | 2.8143 | 2.8671 | 2.8968 | 2.9496 | 2.9793 |
| Fibonacci | 2.7885 | 2.8200 | 2.8395 | 2.8710 | 2.9025 | 2.9220 | 2.9535 |
| Pivot points | S3 | S2 | S1 | PP | R1 | R2 | R3 |
|---|---|---|---|---|---|---|---|
| Standard | 2.4977 | 2.6613 | 2.7507 | 2.9143 | 3.0037 | 3.1673 | 3.2567 |
| Camarilla | 2.7704 | 2.7936 | 2.8168 | 2.8400 | 2.8632 | 2.8864 | 2.9096 |
| Woodie | 2.4605 | 2.6428 | 2.7135 | 2.8958 | 2.9665 | 3.1488 | 3.2195 |
| Fibonacci | 2.6613 | 2.7580 | 2.8177 | 2.9143 | 3.0110 | 3.0707 | 3.1673 |
| Pivot points | S3 | S2 | S1 | PP | R1 | R2 | R3 |
|---|---|---|---|---|---|---|---|
| Standard | 2.0912 | 2.4983 | 2.7492 | 3.1563 | 3.4072 | 3.8143 | 4.0652 |
| Camarilla | 2.8191 | 2.8794 | 2.9397 | 3.0000 | 3.0603 | 3.1206 | 3.1810 |
| Woodie | 2.0130 | 2.4593 | 2.6710 | 3.1173 | 3.3290 | 3.7753 | 3.9870 |
| Fibonacci | 2.4983 | 2.7497 | 2.9050 | 3.1563 | 3.4077 | 3.5630 | 3.8143 |
Numerical data
The following is the status of technical indicators and moving averages registered at the time this technical analysis was created:
| RSI (14): | 37.19 | |
| MACD (12,26,9): | -0.1323 | |
| Directional Movement: | -16.7613 | |
| AROON (14): | -92.8571 | |
| DEMA (21): | 2.8667 | |
| Parabolic SAR (0,02-0,02-0,2): | 3.0669 | |
| Elder Ray (13): | -0.1071 | |
| Super Trend (3,10): | 3.1974 | |
| Zig ZAG (10): | 2.9200 | |
| VORTEX (21): | 0.7996 | |
| Stochastique (14,3,5): | 13.91 | |
| TEMA (21): | 2.8409 | |
| Williams %R (14): | -71.10 | |
| Chande Momentum Oscillator (20): | -0.0800 | |
| Repulse (5,40,3): | -1.2258 | |
| ROCnROLL: | 2 | |
| TRIX (15,9): | -0.5826 | |
| Courbe Coppock: | 11.94 |
| MA7: | 2.9013 | |
| MA20: | 3.0164 | |
| MA50: | 3.3072 | |
| MA100: | 3.5005 | |
| MAexp7: | 2.9169 | |
| MAexp20: | 3.0425 | |
| MAexp50: | 3.4630 | |
| MAexp100: | 7.5877 | |
| Price / MA7: | +0.64% | |
| Price / MA20: | -3.20% | |
| Price / MA50: | -11.71% | |
| Price / MA100: | -16.58% | |
| Price / MAexp7: | +0.11% | |
| Price / MAexp20: | -4.03% | |
| Price / MAexp50: | -15.68% | |
| Price / MAexp100: | -61.52% |
News
Don't forget to follow the news on CASINO GUICHARD. At the time of publication of this analysis, the latest news was as follows:
- Groupe Casino: Completion of sale of Casino’s stake in GreenYellow
- Groupe Casino : Achats d'actions
- Groupe Casino: Termination of Trinity's temporary suspension of certain of its rights in Casino
- Groupe Casino: Sale of GreenYellow
- Groupe Casino - Nombre de droits de vote et d'actions 30-04-2024 / 06-05-2024
About author
Online


Add a comment
Comments
0 comments on the analysis CASINO GUICHARD - Daily