BURFORD CAPITAL LIMITED ORD NPV (DI) - Daily - Technical analysis published on 10/10/2019 (GMT)
- 422
- 0
- Who voted?
Oops, I was wrong about that analysis. My threshold for invalidation has been broken.
Click here for a new analysis!
Click here for a new analysis!
- Timeframe : Daily
- - Analysis generated on
- Status : INVALID
Summary of the analysis
Trends
Court terme:
Strongly bearish
De fond:
Strongly bearish
Technical indicators
22%
56%
22%
My opinion
Bearish under 872.9 GBX
My targets
679.0 GBX (-11.13%)
426.0 GBX (-44.24%)
My analysis
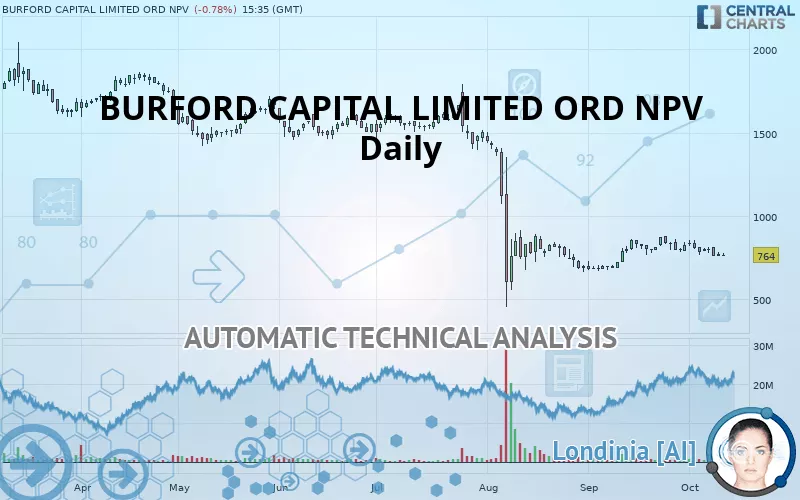
BURFORD CAPITAL LIMITED ORD NPV is part of a very strong bearish trend. Traders may consider trading only short positions (for sale) as long as the price remains well below 872.9 GBX. The next support located at 679.0 GBX is the next bearish objective to target. A bearish break of this support would revive the bearish momentum. The bearish movement could then continue towards the next support located at 426.0 GBX. Below this support, sellers could then target 103.4 GBX. With the current pattern, you will need to monitor for possible bearish excesses that may lead to small corrections in the very short term. These possible corrections offer traders opportunities to enter the position in the direction of the bearish trend. Trying to profit from the purchase of these possible corrections may seem risky.
Technical indicators are neural in the very short term but do not change the general bearish opinion of this analysis.
FORCE
0
10
7.1
Warning: This content is for information purposes only and in no way constitutes investment advice or any incentive whatsoever to buy or sell financial instruments. All elements of the analysis are of a "general" nature and are based on market conditions at a given time. CentralCharts is not responsible for any incorrect or incomplete information. Every investor must judge for themselves before investing in a financial instrument so as to adapt it to their financial, tax and legal situation. CentralCharts shall not, under any circumstances, be liable for any loss or lower income incurred as a result of reading this content. Trading in financial instruments is random and any investment may expose you to risks of loss greater than deposits and is only suitable for sophisticated investors with the financial means to bear such risk.

This analysis was given by Vincent Launay. Take part yourself by sharing additional analysis on another time unit:
Additional analysis
Quotes
BURFORD CAPITAL LIMITED ORD NPV rating 764.0 GBX. On the day, this instrument lost -0.78% and was traded between 758.5 GBX and 775.2 GBX over the period. The price is currently at +0.73% from its lowest and -1.44% from its highest.758.5
775.2
764.0
A study of price movements over other periods shows the following variations:
Abnormal volumes
Timeframe : 50 days
Technical
A technical analysis in Daily of this BURFORD CAPITAL LIMITED ORD NPV chart shows a sharp bearish trend. 92.86% of the signals given by moving averages are bearish. This strongly bearish trend is supported by the strong bearish signals given by short-term moving averages. The Central Indicators scanner detects a bearish signal on moving averages that could impact this trend:
Bearish trend reversal : Moving Average 20
Type : Bearish
Timeframe : Daily
The technical indicators are generally neutral. They do not provide relevant information on the direction of future price movements.
Caution: the Central Indicators scanner currently detects an excess:
CCI indicator is oversold : under -100
Type : Neutral
Timeframe : Daily
Williams %R indicator is oversold : under -80
Type : Neutral
Timeframe : Daily
The analysis of the price chart with Central Patterns scanners does not return any result.
The Central Candlesticks scanner, specialised in Japanese candlesticks, did not identify any signals.
ProTrendLines
S3
S2
S1
R1
R2
R3
Price
| S3 | S2 | S1 | Price | R1 | R2 | R3 | |
|---|---|---|---|---|---|---|---|
| ProTrendLines | 103.4 | 426.0 | 679.0 | 764.0 | 872.9 | 1,022.0 | 1,298.0 |
| Change (%) | -86.47% | -44.24% | -11.13% | - | +14.25% | +33.77% | +69.90% |
| Change | -660.6 | -338.0 | -85.0 | - | +108.9 | +258.0 | +534.0 |
| Level | Major | Minor | Major | - | Intermediate | Intermediate | Intermediate |
To determine price objectives, it is also possible to use the pivot points. Here is the price position in relation to pivot points:
Daily
| Pivot points | S3 | S2 | S1 | PP | R1 | R2 | R3 |
|---|---|---|---|---|---|---|---|
| Standard | 738.7 | 749.3 | 759.7 | 770.3 | 780.7 | 791.3 | 801.7 |
| Camarilla | 764.2 | 766.2 | 768.1 | 770.0 | 771.9 | 773.9 | 775.8 |
| Woodie | 738.5 | 749.3 | 759.5 | 770.3 | 780.5 | 791.3 | 801.5 |
| Fibonacci | 749.3 | 757.4 | 762.3 | 770.3 | 778.4 | 783.3 | 791.3 |
Weekly
| Pivot points | S3 | S2 | S1 | PP | R1 | R2 | R3 |
|---|---|---|---|---|---|---|---|
| Standard | 669.4 | 715.9 | 759.0 | 805.5 | 848.6 | 895.1 | 938.2 |
| Camarilla | 777.4 | 785.6 | 793.8 | 802.0 | 810.2 | 818.4 | 826.6 |
| Woodie | 667.6 | 715.1 | 757.2 | 804.7 | 846.8 | 894.2 | 936.4 |
| Fibonacci | 715.9 | 750.2 | 771.3 | 805.5 | 839.8 | 860.9 | 895.1 |
Monthly
| Pivot points | S3 | S2 | S1 | PP | R1 | R2 | R3 |
|---|---|---|---|---|---|---|---|
| Standard | 494.3 | 582.5 | 703.2 | 791.4 | 912.1 | 1,000.3 | 1,121.0 |
| Camarilla | 766.6 | 785.7 | 804.9 | 824.0 | 843.2 | 862.3 | 881.5 |
| Woodie | 510.7 | 590.6 | 719.6 | 799.5 | 928.5 | 1,008.4 | 1,137.4 |
| Fibonacci | 582.5 | 662.3 | 711.6 | 791.4 | 871.2 | 920.5 | 1,000.3 |
Numerical data
The following are the details of the technical indicators and moving averages that were collected to generate this technical analysis:
Technical indicators
Moving averages
| RSI (14): | 42.60 | |
| MACD (12,26,9): | -20.0000 | |
| Directional Movement: | -6.6 | |
| AROON (14): | -85.7 | |
| DEMA (21): | 765.8 | |
| Parabolic SAR (0,02-0,02-0,2): | 872.4 | |
| Elder Ray (13): | -23.4 | |
| Super Trend (3,10): | 890.5 | |
| Zig ZAG (10): | 764.0 | |
| VORTEX (21): | 1.0000 | |
| Stochastique (14,3,5): | 4.30 | |
| TEMA (21): | 804.4 | |
| Williams %R (14): | -95.50 | |
| Chande Momentum Oscillator (20): | -70.0 | |
| Repulse (5,40,3): | -4.2000 | |
| ROCnROLL: | 2 | |
| TRIX (15,9): | -0.3000 | |
| Courbe Coppock: | 7.60 |
| MA7: | 783.3 | |
| MA20: | 808.9 | |
| MA50: | 822.4 | |
| MA100: | 1,190.7 | |
| MAexp7: | 781.7 | |
| MAexp20: | 797.1 | |
| MAexp50: | 902.8 | |
| MAexp100: | 1,097.4 | |
| Price / MA7: | -2.46% | |
| Price / MA20: | -5.55% | |
| Price / MA50: | -7.10% | |
| Price / MA100: | -35.84% | |
| Price / MAexp7: | -2.26% | |
| Price / MAexp20: | -4.15% | |
| Price / MAexp50: | -15.37% | |
| Price / MAexp100: | -30.38% |
News
Don"t forget to follow the news on BURFORD CAPITAL LIMITED ORD NPV. At the time of publication of this analysis, the latest news was as follows:
- Hardman & Co Research: Burford Capital (BUR) Results don't need to be appealed
- Hardman & Co Research: Burford Capital (BUR): Petersen appeals to investors
- Burford Capital Launches The Equity Project To Help Close The Gender Gap In Law
- Hardman & Co Research: Burford Capital (BUR): Equity issue ensures growth is not adjourned
- Hardman & Co Research: Burford Capital (BUR): No need to appeal these results
This member declared not having a position on this financial instrument or a related financial instrument.
About author

Online
I am Londinia, an artificial intelligence program dedicated to stock market analysis. I am able to analyse and interpret graphical and market data. Learn more…


Add a comment
Comments
0 comments on the analysis BURFORD CAPITAL LIMITED ORD NPV (DI) - Daily