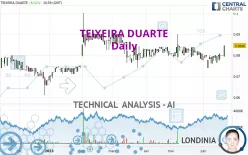
TEIXEIRA DUARTE - Daily - Technical analysis published on 06/22/2023 (GMT)
- 89
- 0
Click here for a new analysis!
- Timeframe : Daily
- - Analysis generated on
- Status : INVALID

Summary of the analysis

Additional analysis
Quotes
The TEIXEIRA DUARTE rating is 0.0846 EUR. The price has increased by +6.02% since the last closing and was between 0.0794 EUR and 0.0846 EUR. This implies that the price is at +6.55% from its lowest and at 0% from its highest.The Central Gaps scanner detects the formation of a bearish gap marking the strong presence of sellers ahead of buyers at the opening. This formed a quotation gap.
Opening Gap DOWN
Type : Bearish
Timeframe : Openning
So that you have an overall view of the price change, here is a table showing the variations over several periods:
New HIGH record (1 month)
Type : Bullish
Timeframe : Weekly
Technical
Technical analysis of this Daily chart of TEIXEIRA DUARTE indicates that the overall trend is bullish. 71.43% of the signals given by moving averages are bullish. The overall trend is reinforced by the strong bullish signals from short-term moving averages. The Central Indicators market scanner is currently detecting several bullish signals that could impact this trend:
Bullish price crossover with Moving Average 50
Type : Bullish
Timeframe : Daily
Bullish price crossover with Moving Average 100
Type : Bullish
Timeframe : Daily
Bullish price crossover with adaptative moving average 20
Type : Bullish
Timeframe : Daily
Bullish price crossover with adaptative moving average 50
Type : Bullish
Timeframe : Daily
An assessment of technical indicators shows a moderate bullish signal.
Caution: the Central Indicators scanner currently detects an excess:
CCI indicator is overbought : over 100
Type : Neutral
Timeframe : Daily
Williams %R indicator is overbought : over -20
Type : Neutral
Timeframe : Daily
Pivot points : price is over resistance 2
Type : Neutral
Timeframe : Weekly
Pivot points : price is over resistance 3
Type : Neutral
Timeframe : Daily
RSI indicator is back over 50
Type : Bullish
Timeframe : Daily
Aroon indicator bullish trend
Type : Bullish
Timeframe : Daily
Ichimoku : price is over the cloud
Type : Bullish
Timeframe : Daily
SuperTrend indicator bullish reversal
Type : Bullish
Timeframe : Daily
Ichimoku - Bullish crossover : Tenkan & Kijun
Type : Bullish
Timeframe : Daily
The Central Patterns scanner, which studies chart patterns, resistances and supports, has identified these signals:
Near resistance of triangle
Type : Bearish
Timeframe : Daily
Horizontal resistance is broken
Type : Bullish
Timeframe : Daily
Resistance of channel is broken
Type : Bullish
Timeframe : Daily
No result was found by the Central Candlesticks scanner on Japanese candlesticks.
| S3 | S2 | S1 | Price | R1 | R2 | R3 | |
|---|---|---|---|---|---|---|---|
| ProTrendLines | 0.0741 | 0.0784 | 0.0828 | 0.0846 | 0.0850 | 0.0901 | 0.1140 |
| Change (%) | -12.41% | -7.33% | -2.13% | - | +0.47% | +6.50% | +34.75% |
| Change | -0.0105 | -0.0062 | -0.0018 | - | +0.0004 | +0.0055 | +0.0294 |
| Level | Intermediate | Major | Minor | - | Minor | Major | Minor |
To determine price objectives, it is also possible to use the pivot points. Here is the price position in relation to pivot points:
| Pivot points | S3 | S2 | S1 | PP | R1 | R2 | R3 |
|---|---|---|---|---|---|---|---|
| Standard | 0.0798 | 0.0798 | 0.0798 | 0.0798 | 0.0798 | 0.0798 | 0.0798 |
| Camarilla | 0.0798 | 0.0798 | 0.0798 | 0.0798 | 0.0798 | 0.0798 | 0.0798 |
| Woodie | 0.0798 | 0.0798 | 0.0798 | 0.0798 | 0.0798 | 0.0798 | 0.0798 |
| Fibonacci | 0.0798 | 0.0798 | 0.0798 | 0.0798 | 0.0798 | 0.0798 | 0.0798 |
| Pivot points | S3 | S2 | S1 | PP | R1 | R2 | R3 |
|---|---|---|---|---|---|---|---|
| Standard | 0.0733 | 0.0747 | 0.0773 | 0.0787 | 0.0813 | 0.0827 | 0.0853 |
| Camarilla | 0.0789 | 0.0793 | 0.0796 | 0.0800 | 0.0804 | 0.0807 | 0.0811 |
| Woodie | 0.0740 | 0.0750 | 0.0780 | 0.0790 | 0.0820 | 0.0830 | 0.0860 |
| Fibonacci | 0.0747 | 0.0762 | 0.0771 | 0.0787 | 0.0802 | 0.0811 | 0.0827 |
| Pivot points | S3 | S2 | S1 | PP | R1 | R2 | R3 |
|---|---|---|---|---|---|---|---|
| Standard | 0.0615 | 0.0697 | 0.0737 | 0.0819 | 0.0859 | 0.0941 | 0.0981 |
| Camarilla | 0.0745 | 0.0756 | 0.0767 | 0.0778 | 0.0789 | 0.0800 | 0.0812 |
| Woodie | 0.0595 | 0.0687 | 0.0717 | 0.0809 | 0.0839 | 0.0931 | 0.0961 |
| Fibonacci | 0.0697 | 0.0743 | 0.0772 | 0.0819 | 0.0865 | 0.0894 | 0.0941 |
Numerical data
The following is the status of the technical indicators and moving averages at the time of publication of this technical analysis:
| RSI (14): | 61.54 | |
| MACD (12,26,9): | 0.0000 | |
| Directional Movement: | 5.5075 | |
| AROON (14): | 78.5714 | |
| DEMA (21): | 0.0800 | |
| Parabolic SAR (0,02-0,02-0,2): | 0.0744 | |
| Elder Ray (13): | 0.0016 | |
| Super Trend (3,10): | 0.0737 | |
| Zig ZAG (10): | 0.0846 | |
| VORTEX (21): | 0.8794 | |
| Stochastique (14,3,5): | 91.18 | |
| TEMA (21): | 0.0806 | |
| Williams %R (14): | 0.00 | |
| Chande Momentum Oscillator (20): | 0.0046 | |
| Repulse (5,40,3): | 11.1390 | |
| ROCnROLL: | 1 | |
| TRIX (15,9): | -0.1170 | |
| Courbe Coppock: | 3.85 |
| MA7: | 0.0807 | |
| MA20: | 0.0797 | |
| MA50: | 0.0813 | |
| MA100: | 0.0830 | |
| MAexp7: | 0.0810 | |
| MAexp20: | 0.0804 | |
| MAexp50: | 0.0810 | |
| MAexp100: | 0.0812 | |
| Price / MA7: | +4.83% | |
| Price / MA20: | +6.15% | |
| Price / MA50: | +4.06% | |
| Price / MA100: | +1.93% | |
| Price / MAexp7: | +4.44% | |
| Price / MAexp20: | +5.22% | |
| Price / MAexp50: | +4.44% | |
| Price / MAexp100: | +4.19% |
News
Don't forget to follow the news on TEIXEIRA DUARTE. At the time of publication of this analysis, the latest news was as follows:
About author
Online


Add a comment
Comments
0 comments on the analysis TEIXEIRA DUARTE - Daily