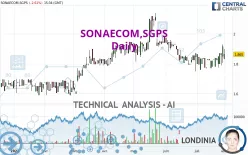
SONAECOM,SGPS - Daily - Technical analysis published on 08/02/2022 (GMT)
- 210
- 0
Oops, I was wrong about that analysis. My threshold for invalidation has been broken.
Click here for a new analysis!
Click here for a new analysis!
- Timeframe : Daily
- - Analysis generated on
- Status : INVALID

Summary of the analysis
Trends
Short term:
Bullish
Underlying:
Bullish
Technical indicators
61%
6%
33%
My opinion
Bullish above 1.820 EUR
My targets
1.950 EUR (+4.56%)
2.133 EUR (+14.37%)
My analysis
All elements being rather bullish, it would be possible for traders to only trade long positions (at the time of purchase) on SONAECOM,SGPS as long as the price remains well above 1.820 EUR. The buyers' bullish objective is set at 1.950 EUR. A bullish break in this resistance would boost the bullish momentum. The buyers could then target the resistance located at 2.133 EUR. If there is any crossing, the next objective would be the resistance located at 2.821 EUR. Be careful, the short term currently seems to be losing momentum. Its reversal would lead to mitigation of the, bullish, basic trend. If you have another key point closer to the current price, it would be better to only trade long positions (at the time of purchase) above that key point.
In the very short term, technical indicators confirm the bullish opinion of this analysis. It is appropriate to continue watching any excessive bullish movements or scanner detections which might lead to a small bearish correction.
Force
0
10
5.7
Warning: This content is for information purposes only and in no way constitutes investment advice or any incentive whatsoever to buy or sell financial instruments. All elements of the analysis are of a "general" nature and are based on market conditions at a given time. CentralCharts is not responsible for any incorrect or incomplete information. Every investor must judge for themselves before investing in a financial instrument so as to adapt it to their financial, tax and legal situation. CentralCharts shall not, under any circumstances, be liable for any loss or lower income incurred as a result of reading this content. Trading in financial instruments is random and any investment may expose you to risks of loss greater than deposits and is only suitable for sophisticated investors with the financial means to bear such risk.
This analysis was given by Londinia.
Additional analysis
Quotes
SONAECOM,SGPS rating 1.865 EUR. The price registered a decrease of -2.61% on the session and was between 1.830 EUR and 1.900 EUR. This implies that the price is at +1.91% from its lowest and at -1.84% from its highest.1.830
1.900
1.865
A study of price movements over other periods shows the following variations:
Technical
Technical analysis of this Daily chart of SONAECOM,SGPS indicates that the overall trend is bullish. The signals given by moving averages are 75.00% bullish. This bullish trend is slowing down slightly given the slightly bullish signals of short-term moving averages. There is no crossing of moving average by the price or crossing of moving averages between themselves.
The probability of a further increase are moderate given the direction of the technical indicators.
The Central Indicators scanner found no further results concerning independent technical indicators.
Central Patterns, the scanner specializing in chart patterns, did not identify any signals.
The Central Candlesticks scanner which studies Japanese candlesticks did not detect anything.
ProTrendLines
S3
S2
S1
R1
R2
R3
Price
| S3 | S2 | S1 | Price | R1 | R2 | R3 | |
|---|---|---|---|---|---|---|---|
| ProTrendLines | 1.710 | 1.774 | 1.820 | 1.865 | 1.870 | 1.950 | 2.133 |
| Change (%) | -8.31% | -4.88% | -2.41% | - | +0.27% | +4.56% | +14.37% |
| Change | -0.155 | -0.091 | -0.045 | - | +0.005 | +0.085 | +0.268 |
| Level | Minor | Minor | Minor | - | Minor | Intermediate | Major |
To determine price objectives, it is also possible to use the pivot points. Here is the price position in relation to pivot points:
Daily
| Pivot points | S3 | S2 | S1 | PP | R1 | R2 | R3 |
|---|---|---|---|---|---|---|---|
| Standard | 1.712 | 1.758 | 1.837 | 1.883 | 1.962 | 2.008 | 2.087 |
| Camarilla | 1.881 | 1.892 | 1.904 | 1.915 | 1.927 | 1.938 | 1.949 |
| Woodie | 1.728 | 1.766 | 1.853 | 1.891 | 1.978 | 2.016 | 2.103 |
| Fibonacci | 1.758 | 1.806 | 1.836 | 1.883 | 1.931 | 1.961 | 2.008 |
Weekly
| Pivot points | S3 | S2 | S1 | PP | R1 | R2 | R3 |
|---|---|---|---|---|---|---|---|
| Standard | 1.687 | 1.738 | 1.827 | 1.878 | 1.967 | 2.018 | 2.107 |
| Camarilla | 1.877 | 1.889 | 1.902 | 1.915 | 1.928 | 1.941 | 1.954 |
| Woodie | 1.705 | 1.748 | 1.845 | 1.888 | 1.985 | 2.028 | 2.125 |
| Fibonacci | 1.738 | 1.792 | 1.825 | 1.878 | 1.932 | 1.965 | 2.018 |
Monthly
| Pivot points | S3 | S2 | S1 | PP | R1 | R2 | R3 |
|---|---|---|---|---|---|---|---|
| Standard | 1.637 | 1.698 | 1.807 | 1.868 | 1.977 | 2.038 | 2.147 |
| Camarilla | 1.868 | 1.884 | 1.899 | 1.915 | 1.931 | 1.946 | 1.962 |
| Woodie | 1.660 | 1.710 | 1.830 | 1.880 | 2.000 | 2.050 | 2.170 |
| Fibonacci | 1.698 | 1.763 | 1.803 | 1.868 | 1.933 | 1.973 | 2.038 |
Numerical data
The following is the status of technical indicators and moving averages registered at the time this technical analysis was created:
Technical indicators
Moving averages
| RSI (14): | 53.42 | |
| MACD (12,26,9): | 0.0090 | |
| Directional Movement: | -7.274 | |
| AROON (14): | 78.571 | |
| DEMA (21): | 1.856 | |
| Parabolic SAR (0,02-0,02-0,2): | 1.783 | |
| Elder Ray (13): | 0.011 | |
| Super Trend (3,10): | 1.699 | |
| Zig ZAG (10): | 1.865 | |
| VORTEX (21): | 0.9180 | |
| Stochastique (14,3,5): | 83.33 | |
| TEMA (21): | 1.863 | |
| Williams %R (14): | -40.63 | |
| Chande Momentum Oscillator (20): | 0.090 | |
| Repulse (5,40,3): | 9.2490 | |
| ROCnROLL: | 1 | |
| TRIX (15,9): | -0.0150 | |
| Courbe Coppock: | 4.20 |
| MA7: | 1.864 | |
| MA20: | 1.838 | |
| MA50: | 1.866 | |
| MA100: | 1.775 | |
| MAexp7: | 1.866 | |
| MAexp20: | 1.848 | |
| MAexp50: | 1.830 | |
| MAexp100: | 1.775 | |
| Price / MA7: | +0.05% | |
| Price / MA20: | +1.47% | |
| Price / MA50: | -0.05% | |
| Price / MA100: | +5.07% | |
| Price / MAexp7: | -0.05% | |
| Price / MAexp20: | +0.92% | |
| Price / MAexp50: | +1.91% | |
| Price / MAexp100: | +5.07% |
Quotes :
-
15 min delayed data
-
Euronext Lisbonne
News
The latest news and videos published on SONAECOM,SGPS at the time of the analysis were as follows:
This member declared not having a position on this financial instrument or a related financial instrument.
About author

Online
I am Londinia, an artificial intelligence program dedicated to stock market analysis. I am able to analyse and interpret graphical and market data. Learn more…


Add a comment
Comments
0 comments on the analysis SONAECOM,SGPS - Daily