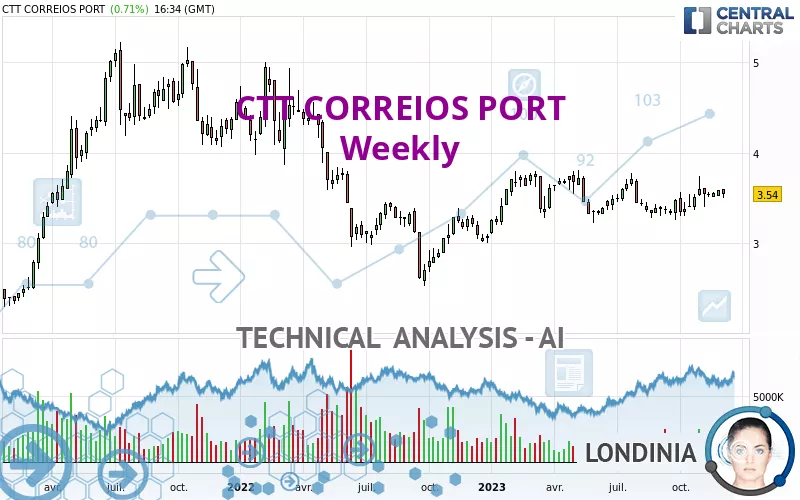
CTT CORREIOS PORT - Weekly - Technical analysis published on 12/09/2023 (GMT)
- 210
- 0
Click here for a new analysis!
- Timeframe : Weekly
- - Analysis generated on
- Status : TARGET REACHED
Summary of the analysis

Additional analysis
Quotes
CTT CORREIOS PORT rating 3.540 EUR. The price is lower by -1.39% over the 5 days and has been traded over the last 5 days between 3.505 EUR and 3.575 EUR. This implies that the 5 day price is +1.00% from its lowest point and -0.98% from its highest point.The Central Gaps scanner detects a bullish opening marking the presence of buyers ahead of sellers at the opening but not sufficiently marked to allow the price to register a quotation gap.
Bullish opening
Type : Bullish
Timeframe : Openning
A study of price movements over other periods shows the following variations:
Near a new HIGH record (1 month)
Type : Bullish
Timeframe : Weekly
Technical
Technical analysis of CTT CORREIOS PORT in Weekly shows an overall bullish trend. The signals given by moving averages are 78.57% bullish. This bullish trend is slowing down slightly given the slightly bullish signals of short-term moving averages. The Central Indicators scanner detects bullish and bearish signals on moving averages that could impact this trend:
Bearish trend reversal : Moving Average 20
Type : Bearish
Timeframe : Weekly
Moving Average bullish crossovers : MA50 & MA100
Type : Bullish
Timeframe : Weekly
In fact, 12 technical indicators on 18 studied are currently positioned bullish. The Central Indicators scanner found this result concerning these indicators:
Pivot points : price is under support 1
Type : Neutral
Timeframe : Weekly
The analysis of the price chart with Central Patterns scanners does not return any result.
For a small setback in the very short term, the Central Candlesticks scanner currently notes the presence of this bearish pattern in Japanese candlesticks:
Dark cloud cover
Type : Bearish
Timeframe : Weekly
| S3 | S2 | S1 | Price | R1 | R2 | R3 | |
|---|---|---|---|---|---|---|---|
| ProTrendLines | 2.139 | 2.520 | 3.114 | 3.540 | 3.723 | 4.361 | 4.871 |
| Change (%) | -39.58% | -28.81% | -12.03% | - | +5.17% | +23.19% | +37.60% |
| Change | -1.401 | -1.020 | -0.426 | - | +0.183 | +0.821 | +1.331 |
| Level | Minor | Intermediate | Major | - | Major | Minor | Major |
To determine price objectives, it is also possible to use the pivot points. Here is the price position in relation to pivot points:
| Pivot points | S3 | S2 | S1 | PP | R1 | R2 | R3 |
|---|---|---|---|---|---|---|---|
| Standard | 3.478 | 3.497 | 3.518 | 3.537 | 3.558 | 3.577 | 3.598 |
| Camarilla | 3.529 | 3.533 | 3.536 | 3.540 | 3.544 | 3.547 | 3.551 |
| Woodie | 3.480 | 3.498 | 3.520 | 3.538 | 3.560 | 3.578 | 3.600 |
| Fibonacci | 3.497 | 3.512 | 3.521 | 3.537 | 3.552 | 3.561 | 3.577 |
| Pivot points | S3 | S2 | S1 | PP | R1 | R2 | R3 |
|---|---|---|---|---|---|---|---|
| Standard | 3.473 | 3.497 | 3.543 | 3.567 | 3.613 | 3.637 | 3.683 |
| Camarilla | 3.571 | 3.577 | 3.584 | 3.590 | 3.596 | 3.603 | 3.609 |
| Woodie | 3.485 | 3.503 | 3.555 | 3.573 | 3.625 | 3.643 | 3.695 |
| Fibonacci | 3.497 | 3.523 | 3.540 | 3.567 | 3.593 | 3.610 | 3.637 |
| Pivot points | S3 | S2 | S1 | PP | R1 | R2 | R3 |
|---|---|---|---|---|---|---|---|
| Standard | 3.062 | 3.233 | 3.397 | 3.568 | 3.732 | 3.903 | 4.067 |
| Camarilla | 3.468 | 3.499 | 3.529 | 3.560 | 3.591 | 3.621 | 3.652 |
| Woodie | 3.058 | 3.231 | 3.393 | 3.566 | 3.728 | 3.901 | 4.063 |
| Fibonacci | 3.233 | 3.361 | 3.440 | 3.568 | 3.696 | 3.775 | 3.903 |
Numerical data
The following are the details of the technical indicators and moving averages that were collected to generate this technical analysis:
| RSI (14): | 54.32 | |
| MACD (12,26,9): | 0.0350 | |
| Directional Movement: | 7.977 | |
| AROON (14): | 35.715 | |
| DEMA (21): | 3.528 | |
| Parabolic SAR (0,02-0,02-0,2): | 3.306 | |
| Elder Ray (13): | 0.047 | |
| Super Trend (3,10): | 3.289 | |
| Zig ZAG (10): | 3.540 | |
| VORTEX (21): | 1.0000 | |
| Stochastique (14,3,5): | 62.85 | |
| TEMA (21): | 3.541 | |
| Williams %R (14): | -41.67 | |
| Chande Momentum Oscillator (20): | 0.175 | |
| Repulse (5,40,3): | 0.8870 | |
| ROCnROLL: | 1 | |
| TRIX (15,9): | 0.0760 | |
| Courbe Coppock: | 7.02 |
| MA7: | 3.546 | |
| MA20: | 3.545 | |
| MA50: | 3.500 | |
| MA100: | 3.458 | |
| MAexp7: | 3.535 | |
| MAexp20: | 3.487 | |
| MAexp50: | 3.446 | |
| MAexp100: | 3.407 | |
| Price / MA7: | -0.17% | |
| Price / MA20: | -0.14% | |
| Price / MA50: | +1.14% | |
| Price / MA100: | +2.37% | |
| Price / MAexp7: | +0.14% | |
| Price / MAexp20: | +1.52% | |
| Price / MAexp50: | +2.73% | |
| Price / MAexp100: | +3.90% |
News
The latest news and videos published on CTT CORREIOS PORT at the time of the analysis were as follows:
- SHAREHOLDER INVESTIGATION NOTICE: Halper Sadeh LLP Investigates HMTV, CTT, ZEN
- Shareholder Alert - The M&A Class Action Firm Continues Investigating the Merger - ZEN, MANT, HMTV, CTT, HNGR, VHAQ
- INVESTIGATION NOTICE: Halper Sadeh LLP Investigates CVET, HMLP, VMW, CTT
- SHAREHOLDER INVESTIGATION ALERT: Halper Sadeh LLP Investigates MANT, PCSB, SWCH, CTT
- INVESTIGATION ALERT: Halper Sadeh LLP Investigates PCSB, TPTX, MUDS, CTT
About author

Online


Add a comment
Comments
0 comments on the analysis CTT CORREIOS PORT - Weekly