NOS, SGPS - 1H - Technical analysis published on 10/01/2024 (GMT)
- 82
- 0
Click here for a new analysis!
- Timeframe : 1H
- - Analysis generated on
- Status : TARGET REACHED
Summary of the analysis

Additional analysis
Quotes
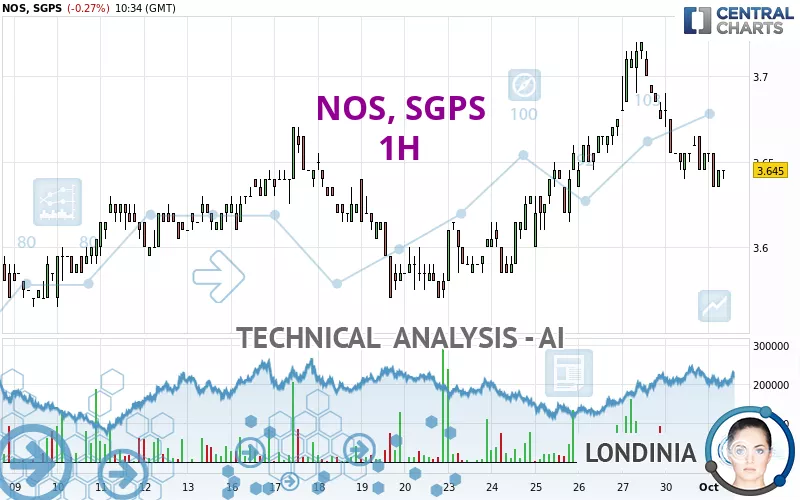
The NOS, SGPS rating is 3.645 EUR. The price registered a decrease of -0.27% on the session and was traded between 3.635 EUR and 3.655 EUR over the period. The price is currently at +0.28% from its lowest and -0.27% from its highest.Here is a more detailed summary of the historical variations registered by NOS, SGPS:
Near a new HIGH record (5 years)
Type : Bullish
Timeframe : Weekly
Near a new HIGH record (1 year)
Type : Bullish
Timeframe : Weekly
Near a new HIGH record (1st january)
Type : Bullish
Timeframe : Weekly
Near a new LOW record (1 month)
Type : Bearish
Timeframe : Weekly
Technical
Technical analysis of this 1H chart of NOS, SGPS indicates that the overall trend is slightly bullish. 57.14% of the signals given by moving averages are bullish. Caution: the strong bearish signals currently given by short-term moving averages indicate that a trend reversal may be taking place. The Central Indicators market scanner currently does not detect any result that concerns moving averages.
The technical indicators are generally neutral. They do not provide relevant information on the direction of future price movements.
But beware of excesses. The Central Indicators scanner currently detects this:
Williams %R indicator is oversold : under -80
Type : Neutral
Timeframe : 1 hour
Price is back under the pivot point
Type : Bearish
Timeframe : Weekly
Central Patterns, the market scanner focusing on chart patterns, resistances and supports found this result:
Near support of channel
Type : Bullish
Timeframe : 1 hour
The Central Candlesticks scanner which studies Japanese candlesticks did not detect anything.
| S3 | S2 | S1 | Price | R1 | R2 | R3 | |
|---|---|---|---|---|---|---|---|
| ProTrendLines | 3.570 | 3.600 | 3.630 | 3.645 | 3.660 | 3.720 | 4.224 |
| Change (%) | -2.06% | -1.23% | -0.41% | - | +0.41% | +2.06% | +15.88% |
| Change | -0.075 | -0.045 | -0.015 | - | +0.015 | +0.075 | +0.579 |
| Level | Intermediate | Intermediate | Intermediate | - | Major | Intermediate | Intermediate |
Pivot points can also be used to set your price objectives. Here is the price situation in relation to pivot points:
| Pivot points | S3 | S2 | S1 | PP | R1 | R2 | R3 |
|---|---|---|---|---|---|---|---|
| Standard | 3.583 | 3.612 | 3.633 | 3.662 | 3.683 | 3.712 | 3.733 |
| Camarilla | 3.641 | 3.646 | 3.650 | 3.655 | 3.660 | 3.664 | 3.669 |
| Woodie | 3.580 | 3.610 | 3.630 | 3.660 | 3.680 | 3.710 | 3.730 |
| Fibonacci | 3.612 | 3.631 | 3.643 | 3.662 | 3.681 | 3.693 | 3.712 |
| Pivot points | S3 | S2 | S1 | PP | R1 | R2 | R3 |
|---|---|---|---|---|---|---|---|
| Standard | 3.457 | 3.518 | 3.597 | 3.658 | 3.737 | 3.798 | 3.877 |
| Camarilla | 3.637 | 3.649 | 3.662 | 3.675 | 3.688 | 3.701 | 3.714 |
| Woodie | 3.465 | 3.523 | 3.605 | 3.663 | 3.745 | 3.803 | 3.885 |
| Fibonacci | 3.518 | 3.572 | 3.605 | 3.658 | 3.712 | 3.745 | 3.798 |
| Pivot points | S3 | S2 | S1 | PP | R1 | R2 | R3 |
|---|---|---|---|---|---|---|---|
| Standard | 3.327 | 3.418 | 3.537 | 3.628 | 3.747 | 3.838 | 3.957 |
| Camarilla | 3.597 | 3.617 | 3.636 | 3.655 | 3.674 | 3.694 | 3.713 |
| Woodie | 3.340 | 3.425 | 3.550 | 3.635 | 3.760 | 3.845 | 3.970 |
| Fibonacci | 3.418 | 3.499 | 3.548 | 3.628 | 3.709 | 3.758 | 3.838 |
Numerical data
The following is the status of technical indicators and moving averages registered at the time this technical analysis was created:
| RSI (14): | 44.02 | |
| MACD (12,26,9): | -0.0040 | |
| Directional Movement: | -17.698 | |
| AROON (14): | -85.714 | |
| DEMA (21): | 3.655 | |
| Parabolic SAR (0,02-0,02-0,2): | 3.655 | |
| Elder Ray (13): | -0.012 | |
| Super Trend (3,10): | 3.679 | |
| Zig ZAG (10): | 3.640 | |
| VORTEX (21): | 0.8070 | |
| Stochastique (14,3,5): | 9.09 | |
| TEMA (21): | 3.642 | |
| Williams %R (14): | -90.91 | |
| Chande Momentum Oscillator (20): | -0.040 | |
| Repulse (5,40,3): | -0.2600 | |
| ROCnROLL: | 2 | |
| TRIX (15,9): | 0.0030 | |
| Courbe Coppock: | 2.42 |
| MA7: | 3.648 | |
| MA20: | 3.619 | |
| MA50: | 3.559 | |
| MA100: | 3.476 | |
| MAexp7: | 3.647 | |
| MAexp20: | 3.658 | |
| MAexp50: | 3.650 | |
| MAexp100: | 3.635 | |
| Price / MA7: | -0.08% | |
| Price / MA20: | +0.72% | |
| Price / MA50: | +2.42% | |
| Price / MA100: | +4.86% | |
| Price / MAexp7: | -0.05% | |
| Price / MAexp20: | -0.36% | |
| Price / MAexp50: | -0.14% | |
| Price / MAexp100: | +0.28% |
About author
Online


Add a comment
Comments
0 comments on the analysis NOS, SGPS - 1H