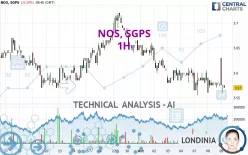
NOS, SGPS - 1H - Technical analysis published on 10/09/2024 (GMT)
- 114
- 0
Click here for a new analysis!
- Timeframe : 1H
- - Analysis generated on
- Status : LEVEL MAINTAINED

Summary of the analysis

Additional analysis
Quotes
The NOS, SGPS price is 3.570 EUR. On the day, this instrument lost -0.14% and was traded between 3.560 EUR and 3.630 EUR over the period. The price is currently at +0.28% from its lowest and -1.65% from its highest.A bullish gap was detected at the opening by the Central Gaps scanner. There are a lot of buyers and they have the upper hand in the very short term.
Opening Gap UP
Type : Bullish
Timeframe : Openning
Here is a more detailed summary of the historical variations registered by NOS, SGPS:
Near a new HIGH record (5 years)
Type : Bullish
Timeframe : Weekly
Near a new HIGH record (1 year)
Type : Bullish
Timeframe : Weekly
Near a new HIGH record (1st january)
Type : Bullish
Timeframe : Weekly
Near a new HIGH record (1 month)
Type : Bullish
Timeframe : Weekly
Technical
Technical analysis of NOS, SGPS in 1H shows a overall strongly bearish trend. 89.29% of the signals given by moving averages are bearish. The slightly bearish signals from short-term moving averages show that the overall trend is slowing down. The Central Indicators market scanner is currently detecting a bullish signal that could impact this trend:
Moving Average bullish crossovers : AMA20 & AMA50
Type : Bullish
Timeframe : 1 hour
The technical indicators are generally neutral. They do not provide relevant information on the direction of future price movements.
Caution: the Central Indicators scanner currently detects an excess:
CCI indicator is oversold : under -100
Type : Neutral
Timeframe : 1 hour
CCI indicator: bullish divergence
Type : Bullish
Timeframe : 1 hour
Williams %R indicator is oversold : under -80
Type : Neutral
Timeframe : 1 hour
An analysis of the price chart with the Central Patterns scanner (detector of chart patterns and resistances and supports) shows a result that can have an impact on the price change:
Near support of channel
Type : Bullish
Timeframe : 1 hour
The Central Candlesticks scanner which studies Japanese candlesticks did not detect anything.
| S3 | S2 | S1 | R1 | Price | R2 | R3 | |
|---|---|---|---|---|---|---|---|
| ProTrendLines | 3.149 | 3.257 | 3.455 | 3.570 | 3.570 | 3.585 | 3.630 |
| Change (%) | -11.79% | -8.77% | -3.22% | 0% | - | +0.42% | +1.68% |
| Change | -0.421 | -0.313 | -0.115 | 0 | - | +0.015 | +0.060 |
| Level | Minor | Major | Minor | Intermediate | - | Minor | Intermediate |
Pivot points can also be used to set your price objectives. Here is the price situation in relation to pivot points:
| Pivot points | S3 | S2 | S1 | PP | R1 | R2 | R3 |
|---|---|---|---|---|---|---|---|
| Standard | 3.530 | 3.545 | 3.560 | 3.575 | 3.590 | 3.605 | 3.620 |
| Camarilla | 3.567 | 3.570 | 3.572 | 3.575 | 3.578 | 3.581 | 3.583 |
| Woodie | 3.530 | 3.545 | 3.560 | 3.575 | 3.590 | 3.605 | 3.620 |
| Fibonacci | 3.545 | 3.557 | 3.564 | 3.575 | 3.587 | 3.594 | 3.605 |
| Pivot points | S3 | S2 | S1 | PP | R1 | R2 | R3 |
|---|---|---|---|---|---|---|---|
| Standard | 3.443 | 3.512 | 3.553 | 3.622 | 3.663 | 3.732 | 3.773 |
| Camarilla | 3.565 | 3.575 | 3.585 | 3.595 | 3.605 | 3.615 | 3.625 |
| Woodie | 3.430 | 3.505 | 3.540 | 3.615 | 3.650 | 3.725 | 3.760 |
| Fibonacci | 3.512 | 3.554 | 3.580 | 3.622 | 3.664 | 3.690 | 3.732 |
| Pivot points | S3 | S2 | S1 | PP | R1 | R2 | R3 |
|---|---|---|---|---|---|---|---|
| Standard | 3.327 | 3.418 | 3.537 | 3.628 | 3.747 | 3.838 | 3.957 |
| Camarilla | 3.597 | 3.617 | 3.636 | 3.655 | 3.674 | 3.694 | 3.713 |
| Woodie | 3.340 | 3.425 | 3.550 | 3.635 | 3.760 | 3.845 | 3.970 |
| Fibonacci | 3.418 | 3.499 | 3.548 | 3.628 | 3.709 | 3.758 | 3.838 |
Numerical data
The following is the status of technical indicators and moving averages registered at the time this technical analysis was created:
| RSI (14): | 38.64 | |
| MACD (12,26,9): | -0.0070 | |
| Directional Movement: | 5.995 | |
| AROON (14): | 64.285 | |
| DEMA (21): | 3.572 | |
| Parabolic SAR (0,02-0,02-0,2): | 3.630 | |
| Elder Ray (13): | -0.006 | |
| Super Trend (3,10): | 3.611 | |
| Zig ZAG (10): | 3.570 | |
| VORTEX (21): | 0.8810 | |
| Stochastique (14,3,5): | 19.05 | |
| TEMA (21): | 3.574 | |
| Williams %R (14): | -85.71 | |
| Chande Momentum Oscillator (20): | -0.030 | |
| Repulse (5,40,3): | -0.8850 | |
| ROCnROLL: | 2 | |
| TRIX (15,9): | -0.0260 | |
| Courbe Coppock: | 0.63 |
| MA7: | 3.599 | |
| MA20: | 3.620 | |
| MA50: | 3.558 | |
| MA100: | 3.487 | |
| MAexp7: | 3.576 | |
| MAexp20: | 3.582 | |
| MAexp50: | 3.596 | |
| MAexp100: | 3.608 | |
| Price / MA7: | -0.81% | |
| Price / MA20: | -1.38% | |
| Price / MA50: | +0.34% | |
| Price / MA100: | +2.38% | |
| Price / MAexp7: | -0.17% | |
| Price / MAexp20: | -0.34% | |
| Price / MAexp50: | -0.72% | |
| Price / MAexp100: | -1.05% |
About author
Online


Add a comment
Comments
0 comments on the analysis NOS, SGPS - 1H