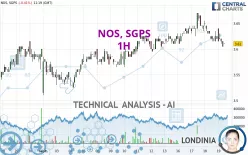
NOS, SGPS - 1H - Technical analysis published on 09/19/2024 (GMT)
- 96
- 0
Click here for a new analysis!
- Timeframe : 1H
- - Analysis generated on
- Status : LEVEL MAINTAINED

Summary of the analysis

Additional analysis
Quotes
The NOS, SGPS rating is 3.610 EUR. On the day, this instrument lost -0.41% and was between 3.605 EUR and 3.640 EUR. This implies that the price is at +0.14% from its lowest and at -0.82% from its highest.The Central Gaps scanner detects a bullish opening marking the presence of buyers ahead of sellers at the opening but not sufficiently marked to allow the price to register a quotation gap.
Bullish opening
Type : Bullish
Timeframe : Openning
So that you have an overall view of the price change, here is a table showing the variations over several periods:
Near a new HIGH record (5 years)
Type : Bullish
Timeframe : Weekly
Near a new HIGH record (1 year)
Type : Bullish
Timeframe : Weekly
Near a new HIGH record (1st january)
Type : Bullish
Timeframe : Weekly
Near a new LOW record (1 month)
Type : Bearish
Timeframe : Weekly
Technical
Technical analysis of this 1H chart of NOS, SGPS indicates that the overall trend is slightly bullish. 57.14% of the signals given by moving averages are bullish. Caution: the strong bearish signals currently given by short-term moving averages indicate that a trend reversal may be taking place. There is no crossing of moving average by the price or crossing of moving averages between themselves.
Technical indicators are bearish. There is still some doubt about the decline in the price.
But beware of excesses. The Central Indicators scanner currently detects this:
CCI indicator is oversold : under -100
Type : Neutral
Timeframe : 1 hour
Williams %R indicator is oversold : under -80
Type : Neutral
Timeframe : 1 hour
Central Patterns, the market scanner focusing on chart patterns, resistances and supports found these results:
Near horizontal support
Type : Bullish
Timeframe : 1 hour
Support of channel is broken
Type : Bearish
Timeframe : 1 hour
No result was found by the Central Candlesticks scanner on Japanese candlesticks.
| S3 | S2 | S1 | Price | R1 | R2 | R3 | |
|---|---|---|---|---|---|---|---|
| ProTrendLines | 3.510 | 3.565 | 3.600 | 3.610 | 3.630 | 3.660 | 4.224 |
| Change (%) | -2.77% | -1.25% | -0.28% | - | +0.55% | +1.39% | +17.01% |
| Change | -0.100 | -0.045 | -0.010 | - | +0.020 | +0.050 | +0.614 |
| Level | Minor | Intermediate | Intermediate | - | Intermediate | Major | Intermediate |
Attention could also be paid to pivot points to set price objectives:
| Pivot points | S3 | S2 | S1 | PP | R1 | R2 | R3 |
|---|---|---|---|---|---|---|---|
| Standard | 3.568 | 3.592 | 3.608 | 3.632 | 3.648 | 3.672 | 3.688 |
| Camarilla | 3.614 | 3.618 | 3.621 | 3.625 | 3.629 | 3.632 | 3.636 |
| Woodie | 3.565 | 3.590 | 3.605 | 3.630 | 3.645 | 3.670 | 3.685 |
| Fibonacci | 3.592 | 3.607 | 3.616 | 3.632 | 3.647 | 3.656 | 3.672 |
| Pivot points | S3 | S2 | S1 | PP | R1 | R2 | R3 |
|---|---|---|---|---|---|---|---|
| Standard | 3.518 | 3.542 | 3.583 | 3.607 | 3.648 | 3.672 | 3.713 |
| Camarilla | 3.607 | 3.613 | 3.619 | 3.625 | 3.631 | 3.637 | 3.643 |
| Woodie | 3.528 | 3.546 | 3.593 | 3.611 | 3.658 | 3.676 | 3.723 |
| Fibonacci | 3.542 | 3.567 | 3.582 | 3.607 | 3.632 | 3.647 | 3.672 |
| Pivot points | S3 | S2 | S1 | PP | R1 | R2 | R3 |
|---|---|---|---|---|---|---|---|
| Standard | 3.180 | 3.270 | 3.435 | 3.525 | 3.690 | 3.780 | 3.945 |
| Camarilla | 3.530 | 3.553 | 3.577 | 3.600 | 3.623 | 3.647 | 3.670 |
| Woodie | 3.218 | 3.289 | 3.473 | 3.544 | 3.728 | 3.799 | 3.983 |
| Fibonacci | 3.270 | 3.367 | 3.428 | 3.525 | 3.622 | 3.683 | 3.780 |
Numerical data
The following is the status of the technical indicators and moving averages at the time of publication of this technical analysis:
| RSI (14): | 40.82 | |
| MACD (12,26,9): | -0.0040 | |
| Directional Movement: | -1.897 | |
| AROON (14): | -85.714 | |
| DEMA (21): | 3.624 | |
| Parabolic SAR (0,02-0,02-0,2): | 3.640 | |
| Elder Ray (13): | -0.014 | |
| Super Trend (3,10): | 3.645 | |
| Zig ZAG (10): | 3.615 | |
| VORTEX (21): | 0.8430 | |
| Stochastique (14,3,5): | 13.70 | |
| TEMA (21): | 3.616 | |
| Williams %R (14): | -80.00 | |
| Chande Momentum Oscillator (20): | -0.035 | |
| Repulse (5,40,3): | 0.0000 | |
| ROCnROLL: | 2 | |
| TRIX (15,9): | -0.0020 | |
| Courbe Coppock: | 1.59 |
| MA7: | 3.624 | |
| MA20: | 3.588 | |
| MA50: | 3.549 | |
| MA100: | 3.451 | |
| MAexp7: | 3.619 | |
| MAexp20: | 3.626 | |
| MAexp50: | 3.623 | |
| MAexp100: | 3.606 | |
| Price / MA7: | -0.39% | |
| Price / MA20: | +0.61% | |
| Price / MA50: | +1.72% | |
| Price / MA100: | +4.61% | |
| Price / MAexp7: | -0.25% | |
| Price / MAexp20: | -0.44% | |
| Price / MAexp50: | -0.36% | |
| Price / MAexp100: | +0.11% |
About author
Online


Add a comment
Comments
0 comments on the analysis NOS, SGPS - 1H