NOS, SGPS - Daily - Technical analysis published on 11/22/2024 (GMT)
- 90
- 0
- Timeframe : Daily
- - Analysis generated on
- Status : NEUTRAL
Summary of the analysis

Additional analysis
Quotes
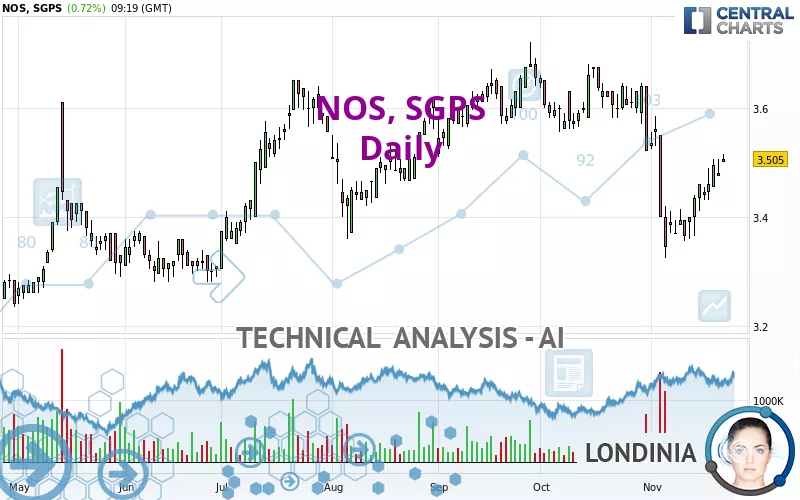
The NOS, SGPS rating is 3.505 EUR. The price registered an increase of +0.72% on the session and was traded between 3.500 EUR and 3.515 EUR over the period. The price is currently at +0.14% from its lowest and -0.28% from its highest.The Central Gaps scanner detects a bullish opening marking the presence of buyers ahead of sellers at the opening but not sufficiently marked to allow the price to register a quotation gap.
Bullish opening
Type : Bullish
Timeframe : Openning
Here is a more detailed summary of the historical variations registered by NOS, SGPS:
Near a new LOW record (1 month)
Type : Bearish
Timeframe : Weekly
Technical
Technical analysis of NOS, SGPS in Daily shows a neutral overall trend. This generally neutral trend is confirmed by the neutral signals currently given by short-term moving averages. The Central Indicators scanner detects a bullish signal on moving averages that could impact this trend:
Bullish price crossover with adaptative moving average 20
Type : Bullish
Timeframe : Daily
In fact, 12 technical indicators on 18 studied are currently positioned bullish. But beware of excesses. The Central Indicators scanner currently detects this:
Williams %R indicator is overbought : over -20
Type : Neutral
Timeframe : Daily
Pivot points : price is over resistance 1
Type : Neutral
Timeframe : Daily
Pivot points : price is over resistance 1
Type : Neutral
Timeframe : Weekly
RSI indicator is back over 50
Type : Bullish
Timeframe : Daily
The Central Patterns scanner, which studies chart patterns, resistances and supports, has identified these signals:
Near horizontal resistance
Type : Bearish
Timeframe : Daily
Resistance of channel is broken
Type : Bullish
Timeframe : Daily
The Central Candlesticks scanner which studies Japanese candlesticks did not detect anything.
| S3 | S2 | S1 | Price | R1 | R2 | R3 | |
|---|---|---|---|---|---|---|---|
| ProTrendLines | 3.149 | 3.257 | 3.498 | 3.505 | 3.572 | 3.660 | 4.224 |
| Change (%) | -10.16% | -7.08% | -0.20% | - | +1.91% | +4.42% | +20.51% |
| Change | -0.356 | -0.248 | -0.007 | - | +0.067 | +0.155 | +0.719 |
| Level | Minor | Major | Major | - | Intermediate | Major | Intermediate |
To determine price objectives, it is also possible to use the pivot points. Here is the price position in relation to pivot points:
| Pivot points | S3 | S2 | S1 | PP | R1 | R2 | R3 |
|---|---|---|---|---|---|---|---|
| Standard | 3.438 | 3.457 | 3.468 | 3.487 | 3.498 | 3.517 | 3.528 |
| Camarilla | 3.472 | 3.475 | 3.477 | 3.480 | 3.483 | 3.486 | 3.488 |
| Woodie | 3.435 | 3.455 | 3.465 | 3.485 | 3.495 | 3.515 | 3.525 |
| Fibonacci | 3.457 | 3.468 | 3.475 | 3.487 | 3.498 | 3.505 | 3.517 |
| Pivot points | S3 | S2 | S1 | PP | R1 | R2 | R3 |
|---|---|---|---|---|---|---|---|
| Standard | 3.285 | 3.320 | 3.390 | 3.425 | 3.495 | 3.530 | 3.600 |
| Camarilla | 3.431 | 3.441 | 3.450 | 3.460 | 3.470 | 3.479 | 3.489 |
| Woodie | 3.303 | 3.329 | 3.408 | 3.434 | 3.513 | 3.539 | 3.618 |
| Fibonacci | 3.320 | 3.360 | 3.385 | 3.425 | 3.465 | 3.490 | 3.530 |
| Pivot points | S3 | S2 | S1 | PP | R1 | R2 | R3 |
|---|---|---|---|---|---|---|---|
| Standard | 3.307 | 3.413 | 3.467 | 3.573 | 3.627 | 3.733 | 3.787 |
| Camarilla | 3.476 | 3.491 | 3.505 | 3.520 | 3.535 | 3.549 | 3.564 |
| Woodie | 3.280 | 3.400 | 3.440 | 3.560 | 3.600 | 3.720 | 3.760 |
| Fibonacci | 3.413 | 3.475 | 3.512 | 3.573 | 3.635 | 3.672 | 3.733 |
Numerical data
The following is the status of technical indicators and moving averages registered at the time this technical analysis was created:
| RSI (14): | 51.98 | |
| MACD (12,26,9): | -0.0260 | |
| Directional Movement: | -0.727 | |
| AROON (14): | -14.286 | |
| DEMA (21): | 3.440 | |
| Parabolic SAR (0,02-0,02-0,2): | 3.342 | |
| Elder Ray (13): | 0.040 | |
| Super Trend (3,10): | 3.546 | |
| Zig ZAG (10): | 3.510 | |
| VORTEX (21): | 0.8570 | |
| Stochastique (14,3,5): | 69.07 | |
| TEMA (21): | 3.437 | |
| Williams %R (14): | -17.78 | |
| Chande Momentum Oscillator (20): | 0.165 | |
| Repulse (5,40,3): | 1.0800 | |
| ROCnROLL: | -1 | |
| TRIX (15,9): | -0.1760 | |
| Courbe Coppock: | 3.37 |
| MA7: | 3.469 | |
| MA20: | 3.471 | |
| MA50: | 3.560 | |
| MA100: | 3.548 | |
| MAexp7: | 3.472 | |
| MAexp20: | 3.481 | |
| MAexp50: | 3.520 | |
| MAexp100: | 3.498 | |
| Price / MA7: | +1.04% | |
| Price / MA20: | +0.98% | |
| Price / MA50: | -1.54% | |
| Price / MA100: | -1.21% | |
| Price / MAexp7: | +0.95% | |
| Price / MAexp20: | +0.69% | |
| Price / MAexp50: | -0.43% | |
| Price / MAexp100: | +0.20% |
About author
Online


Add a comment
Comments
0 comments on the analysis NOS, SGPS - Daily