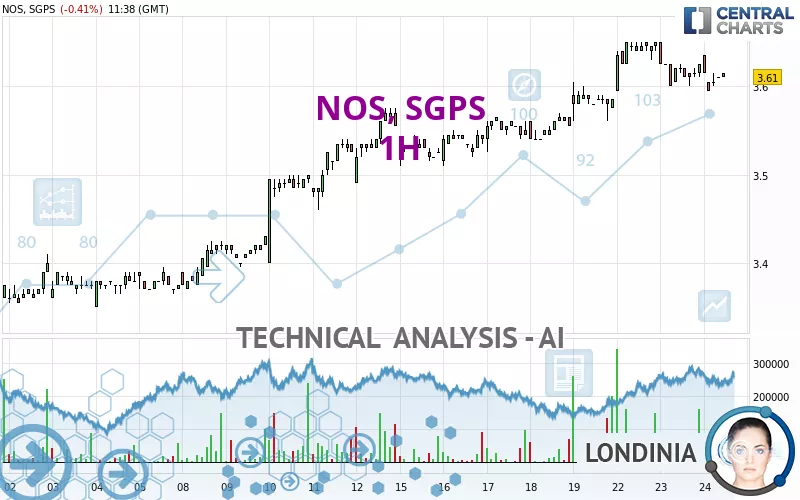
NOS, SGPS - 1H - Technical analysis published on 07/24/2024 (GMT)
- 83
- 0
Click here for a new analysis!
- Timeframe : 1H
- - Analysis generated on
- Status : LEVEL MAINTAINED
Summary of the analysis

Additional analysis
Quotes
NOS, SGPS rating 3.610 EUR. The price is lower by -0.41% since the last closing with the lowest point at 3.595 EUR and the highest point at 3.635 EUR. The deviation from the price is +0.42% for the low point and -0.69% for the high point.The Central Gaps scanner detects a bullish opening marking the presence of buyers ahead of sellers at the opening but not sufficiently marked to allow the price to register a quotation gap.
Bullish opening
Type : Bullish
Timeframe : Openning
Here is a more detailed summary of the historical variations registered by NOS, SGPS:
Near a new HIGH record (5 years)
Type : Bullish
Timeframe : Weekly
Near a new HIGH record (1 year)
Type : Bullish
Timeframe : Weekly
Near a new HIGH record (1st january)
Type : Bullish
Timeframe : Weekly
Near a new HIGH record (1 month)
Type : Bullish
Timeframe : Weekly
Technical
Technical analysis of NOS, SGPS in 1H shows an overall bullish trend. The signals given by moving averages are 75.00% bullish. This bullish trend could slow down given the neutral signals currently being given by short-term moving averages. The Central Indicators market scanner currently does not detect any result that concerns moving averages.
An assessment of technical indicators does not currently provide any relevant information to suggest whether the signal given by the technical indicators is more bullish or bearish.
No additional result has been identified by Central Indicators, the scanner specialised in technical indicators.
The Central Patterns scanner, which studies chart patterns, resistances and supports, has identified this signal:
Near support of triangle
Type : Bullish
Timeframe : 1 hour
The Central Candlesticks scanner currently notes the presence of this pattern in Japanese candlesticks that could mark the end of the short-term trend currently underway:
Doji
Type : Neutral
Timeframe : 1 hour
| S3 | S2 | S1 | Price | R1 | R2 | |
|---|---|---|---|---|---|---|
| ProTrendLines | 3.410 | 3.555 | 3.600 | 3.610 | 3.660 | 4.224 |
| Change (%) | -5.54% | -1.52% | -0.28% | - | +1.39% | +17.01% |
| Change | -0.200 | -0.055 | -0.010 | - | +0.050 | +0.614 |
| Level | Minor | Intermediate | Minor | - | Major | Intermediate |
To determine price objectives, it is also possible to use the pivot points. Here is the price position in relation to pivot points:
| Pivot points | S3 | S2 | S1 | PP | R1 | R2 | R3 |
|---|---|---|---|---|---|---|---|
| Standard | 3.550 | 3.575 | 3.600 | 3.625 | 3.650 | 3.675 | 3.700 |
| Camarilla | 3.611 | 3.616 | 3.620 | 3.625 | 3.630 | 3.634 | 3.639 |
| Woodie | 3.550 | 3.575 | 3.600 | 3.625 | 3.650 | 3.675 | 3.700 |
| Fibonacci | 3.575 | 3.594 | 3.606 | 3.625 | 3.644 | 3.656 | 3.675 |
| Pivot points | S3 | S2 | S1 | PP | R1 | R2 | R3 |
|---|---|---|---|---|---|---|---|
| Standard | 3.433 | 3.472 | 3.528 | 3.567 | 3.623 | 3.662 | 3.718 |
| Camarilla | 3.559 | 3.568 | 3.576 | 3.585 | 3.594 | 3.602 | 3.611 |
| Woodie | 3.443 | 3.476 | 3.538 | 3.571 | 3.633 | 3.666 | 3.728 |
| Fibonacci | 3.472 | 3.508 | 3.530 | 3.567 | 3.603 | 3.625 | 3.662 |
| Pivot points | S3 | S2 | S1 | PP | R1 | R2 | R3 |
|---|---|---|---|---|---|---|---|
| Standard | 3.170 | 3.225 | 3.265 | 3.320 | 3.360 | 3.415 | 3.455 |
| Camarilla | 3.279 | 3.288 | 3.296 | 3.305 | 3.314 | 3.322 | 3.331 |
| Woodie | 3.163 | 3.221 | 3.258 | 3.316 | 3.353 | 3.411 | 3.448 |
| Fibonacci | 3.225 | 3.261 | 3.284 | 3.320 | 3.356 | 3.379 | 3.415 |
Numerical data
The following are the details of the technical indicators and moving averages that were collected to generate this technical analysis:
| RSI (14): | 52.48 | |
| MACD (12,26,9): | 0.0040 | |
| Directional Movement: | 1.536 | |
| AROON (14): | -78.571 | |
| DEMA (21): | 3.620 | |
| Parabolic SAR (0,02-0,02-0,2): | 3.647 | |
| Elder Ray (13): | -0.001 | |
| Super Trend (3,10): | 3.646 | |
| Zig ZAG (10): | 3.615 | |
| VORTEX (21): | 0.9310 | |
| Stochastique (14,3,5): | 27.27 | |
| TEMA (21): | 3.611 | |
| Williams %R (14): | -63.64 | |
| Chande Momentum Oscillator (20): | -0.010 | |
| Repulse (5,40,3): | -0.1620 | |
| ROCnROLL: | 1 | |
| TRIX (15,9): | 0.0320 | |
| Courbe Coppock: | 1.45 |
| MA7: | 3.588 | |
| MA20: | 3.479 | |
| MA50: | 3.397 | |
| MA100: | 3.311 | |
| MAexp7: | 3.611 | |
| MAexp20: | 3.613 | |
| MAexp50: | 3.592 | |
| MAexp100: | 3.549 | |
| Price / MA7: | +0.61% | |
| Price / MA20: | +3.77% | |
| Price / MA50: | +6.27% | |
| Price / MA100: | +9.03% | |
| Price / MAexp7: | -0.03% | |
| Price / MAexp20: | -0.08% | |
| Price / MAexp50: | +0.50% | |
| Price / MAexp100: | +1.72% |
About author
Online


Add a comment
Comments
0 comments on the analysis NOS, SGPS - 1H