EDP RENOVAVEIS - 1H - Technical analysis published on 03/20/2025 (GMT)
- 72
- 0
Click here for a new analysis!
- Timeframe : 1H
- - Analysis generated on
- Status : LEVEL MAINTAINED
Summary of the analysis

Additional analysis
Quotes
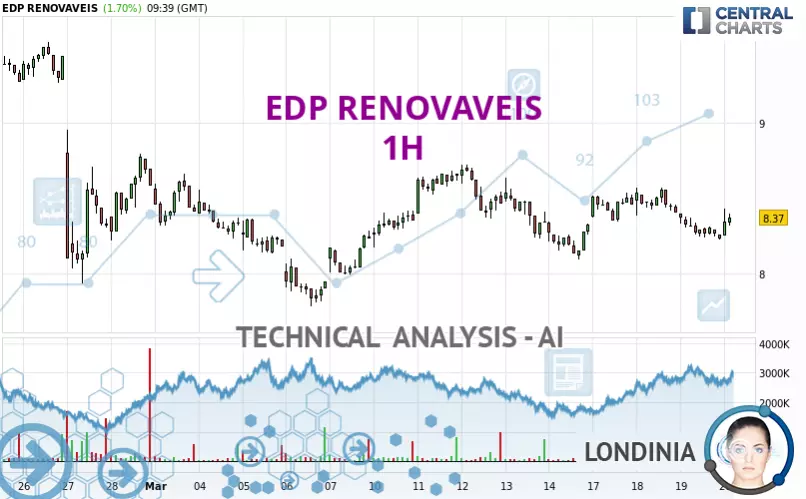
The EDP RENOVAVEIS rating is 8.370 EUR. The price has increased by +1.70% since the last closing with the lowest point at 8.250 EUR and the highest point at 8.430 EUR. The deviation from the price is +1.45% for the low point and -0.71% for the high point.A study of price movements over other periods shows the following variations:
Technical
Technical analysis of EDP RENOVAVEIS in 1H shows an overall slightly bearish trend. Only 60.71% of the signals given by moving averages are bearish. This slightly bearish trend is not supported by the signals currently being given by short-term moving averages. The Central Indicators market scanner is currently detecting several bullish signals that could impact this trend:
Bullish trend reversal : Moving Average 100
Type : Bullish
Timeframe : 1 hour
Bullish price crossover with Moving Average 50
Type : Bullish
Timeframe : 1 hour
Bullish price crossover with adaptative moving average 20
Type : Bullish
Timeframe : 1 hour
Bullish price crossover with adaptative moving average 50
Type : Bullish
Timeframe : 1 hour
On the 18 technical indicators analysed, 5 are bullish, 7 are neutral and 6 are bearish. Other results related to technical indicators were also found by the Central Indicators scanner:
Pivot points : price is over resistance 1 (Daily)
Type : Neutral
Timeframe : 1 hour
RSI indicator is back over 50
Type : Bullish
Timeframe : 1 hour
Williams %R indicator is back over -50
Type : Bullish
Timeframe : 1 hour
An analysis of the price chart with the Central Patterns scanner (detector of chart patterns and resistances and supports) shows a result that can have an impact on the price change:
Near support of triangle
Type : Bullish
Timeframe : 1 hour
The Central Candlesticks scanner, specialised in Japanese candlesticks, did not identify any signals.
| S3 | S2 | S1 | Price | R1 | R2 | R3 | |
|---|---|---|---|---|---|---|---|
| ProTrendLines | 7.780 | 7.945 | 8.095 | 8.370 | 8.389 | 8.570 | 8.730 |
| Change (%) | -7.05% | -5.08% | -3.29% | - | +0.23% | +2.39% | +4.30% |
| Change | -0.590 | -0.425 | -0.275 | - | +0.019 | +0.200 | +0.360 |
| Level | Minor | Major | Intermediate | - | Minor | Intermediate | Intermediate |
Pivot points can also be used to set your price objectives. Here is the price situation in relation to pivot points:
| Pivot points | S3 | S2 | S1 | PP | R1 | R2 | R3 |
|---|---|---|---|---|---|---|---|
| Standard | 7.995 | 8.110 | 8.170 | 8.285 | 8.345 | 8.460 | 8.520 |
| Camarilla | 8.182 | 8.198 | 8.214 | 8.230 | 8.246 | 8.262 | 8.278 |
| Woodie | 7.968 | 8.096 | 8.143 | 8.271 | 8.318 | 8.446 | 8.493 |
| Fibonacci | 8.110 | 8.177 | 8.218 | 8.285 | 8.352 | 8.393 | 8.460 |
| Pivot points | S3 | S2 | S1 | PP | R1 | R2 | R3 |
|---|---|---|---|---|---|---|---|
| Standard | 7.415 | 7.755 | 8.040 | 8.380 | 8.665 | 9.005 | 9.290 |
| Camarilla | 8.153 | 8.210 | 8.268 | 8.325 | 8.382 | 8.440 | 8.497 |
| Woodie | 7.388 | 7.741 | 8.013 | 8.366 | 8.638 | 8.991 | 9.263 |
| Fibonacci | 7.755 | 7.994 | 8.141 | 8.380 | 8.619 | 8.766 | 9.005 |
| Pivot points | S3 | S2 | S1 | PP | R1 | R2 | R3 |
|---|---|---|---|---|---|---|---|
| Standard | 6.228 | 7.082 | 7.833 | 8.687 | 9.438 | 10.292 | 11.043 |
| Camarilla | 8.144 | 8.291 | 8.438 | 8.585 | 8.732 | 8.879 | 9.026 |
| Woodie | 6.178 | 7.056 | 7.783 | 8.661 | 9.388 | 10.266 | 10.993 |
| Fibonacci | 7.082 | 7.695 | 8.074 | 8.687 | 9.300 | 9.679 | 10.292 |
Numerical data
The following is the status of technical indicators and moving averages registered at the time this technical analysis was created:
| RSI (14): | 48.39 | |
| MACD (12,26,9): | -0.0320 | |
| Directional Movement: | 4.272 | |
| AROON (14): | -85.714 | |
| DEMA (21): | 8.308 | |
| Parabolic SAR (0,02-0,02-0,2): | 8.225 | |
| Elder Ray (13): | 0.032 | |
| Super Trend (3,10): | 8.443 | |
| Zig ZAG (10): | 8.320 | |
| VORTEX (21): | 0.8800 | |
| Stochastique (14,3,5): | 23.52 | |
| TEMA (21): | 8.284 | |
| Williams %R (14): | -61.19 | |
| Chande Momentum Oscillator (20): | -0.095 | |
| Repulse (5,40,3): | 0.4450 | |
| ROCnROLL: | -1 | |
| TRIX (15,9): | -0.0380 | |
| Courbe Coppock: | 4.32 |
| MA7: | 8.371 | |
| MA20: | 8.521 | |
| MA50: | 8.757 | |
| MA100: | 9.691 | |
| MAexp7: | 8.319 | |
| MAexp20: | 8.348 | |
| MAexp50: | 8.375 | |
| MAexp100: | 8.403 | |
| Price / MA7: | -0.01% | |
| Price / MA20: | -1.77% | |
| Price / MA50: | -4.42% | |
| Price / MA100: | -13.63% | |
| Price / MAexp7: | +0.61% | |
| Price / MAexp20: | +0.26% | |
| Price / MAexp50: | -0.06% | |
| Price / MAexp100: | -0.39% |
News
The last news published on EDP RENOVAVEIS at the time of the generation of this analysis was as follows:
- EDP Renewables Announces Promotion of Gabriel Yamal to Executive Vice President
- EDP Renewables, Salt River Project, and Meta Unveil Brittlebush Solar Park in Arizona
- EDP Renewables Cuts Ribbon on Scarlet I Solar Energy Park in Fresno County, CA
- EDPR NA Distributed Generation Acquires Renewable Properties’ Community Solar Portfolio in Illinois
- EDP Renewables Introduces its Arkansas Solar Park in Mississippi County
About author
Online


Add a comment
Comments
0 comments on the analysis EDP RENOVAVEIS - 1H