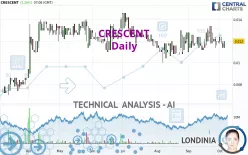
CRESCENT - Daily - Technical analysis published on 10/04/2024 (GMT)
- 118
- 0
- Timeframe : Daily
- - Analysis generated on
- Status : NEUTRAL

Summary of the analysis

Additional analysis
Quotes
The CRESCENT price is 0.0120 EUR. The price registered an increase of +5.26% on the session and was between 0.0114 EUR and 0.0120 EUR. This implies that the price is at +5.26% from its lowest and at 0% from its highest.A study of price movements over other periods shows the following variations:
Near a new LOW record (1 month)
Type : Bearish
Timeframe : Weekly
Technical
Technical analysis of this Daily chart of CRESCENT indicates that the overall trend is slightly bullish. 50.00% of the signals given by moving averages are bullish. As the signals currently given by short-term moving averages are rather neutral, the overall trend could quickly return to neutral as well. An assessment of moving averages reveals several bullish signals that could impact this trend:
Bullish price crossover with Moving Average 20
Type : Bullish
Timeframe : Daily
Bullish price crossover with Moving Average 50
Type : Bullish
Timeframe : Daily
Bullish price crossover with adaptative moving average 20
Type : Bullish
Timeframe : Daily
Bullish price crossover with adaptative moving average 100
Type : Bullish
Timeframe : Daily
Technical indicators are slightly bullish. There is therefore considerable uncertainty about the continuation of the increase.
Central Indicators, the scanner specialised in technical indicators, has identified these signals:
Pivot points : price is over resistance 1
Type : Neutral
Timeframe : Daily
RSI indicator is back over 50
Type : Bullish
Timeframe : Daily
Ichimoku - Bearish crossover : Tenkan & Kijun
Type : Bearish
Timeframe : Daily
Central Patterns, the market scanner focusing on chart patterns, resistances and supports found these results:
Near horizontal support
Type : Bullish
Timeframe : Daily
Support of channel is broken
Type : Bearish
Timeframe : Daily
No result was found by the Central Candlesticks scanner on Japanese candlesticks.
| S3 | S2 | S1 | Price | R1 | R2 | R3 | |
|---|---|---|---|---|---|---|---|
| ProTrendLines | 0.0094 | 0.0109 | 0.0118 | 0.0120 | 0.0128 | 0.0138 | 0.0146 |
| Change (%) | -21.67% | -9.17% | -1.67% | - | +6.67% | +15.00% | +21.67% |
| Change | -0.0026 | -0.0011 | -0.0002 | - | +0.0008 | +0.0018 | +0.0026 |
| Level | Minor | Major | Minor | - | Intermediate | Intermediate | Minor |
Pivot points can also be used to set your price objectives. Here is the price situation in relation to pivot points:
| Pivot points | S3 | S2 | S1 | PP | R1 | R2 | R3 |
|---|---|---|---|---|---|---|---|
| Standard | 0.0106 | 0.0110 | 0.0112 | 0.0116 | 0.0118 | 0.0122 | 0.0124 |
| Camarilla | 0.0112 | 0.0113 | 0.0114 | 0.0114 | 0.0115 | 0.0115 | 0.0116 |
| Woodie | 0.0105 | 0.0110 | 0.0111 | 0.0116 | 0.0117 | 0.0122 | 0.0123 |
| Fibonacci | 0.0110 | 0.0112 | 0.0114 | 0.0116 | 0.0118 | 0.0120 | 0.0122 |
| Pivot points | S3 | S2 | S1 | PP | R1 | R2 | R3 |
|---|---|---|---|---|---|---|---|
| Standard | 0.0091 | 0.0103 | 0.0111 | 0.0123 | 0.0131 | 0.0143 | 0.0151 |
| Camarilla | 0.0115 | 0.0116 | 0.0118 | 0.0120 | 0.0122 | 0.0124 | 0.0126 |
| Woodie | 0.0090 | 0.0102 | 0.0110 | 0.0122 | 0.0130 | 0.0142 | 0.0150 |
| Fibonacci | 0.0103 | 0.0110 | 0.0115 | 0.0123 | 0.0130 | 0.0135 | 0.0143 |
| Pivot points | S3 | S2 | S1 | PP | R1 | R2 | R3 |
|---|---|---|---|---|---|---|---|
| Standard | 0.0085 | 0.0097 | 0.0109 | 0.0121 | 0.0133 | 0.0145 | 0.0157 |
| Camarilla | 0.0113 | 0.0116 | 0.0118 | 0.0120 | 0.0122 | 0.0124 | 0.0127 |
| Woodie | 0.0084 | 0.0097 | 0.0108 | 0.0121 | 0.0132 | 0.0145 | 0.0156 |
| Fibonacci | 0.0097 | 0.0107 | 0.0112 | 0.0121 | 0.0131 | 0.0136 | 0.0145 |
Numerical data
The following is the status of technical indicators and moving averages registered at the time this technical analysis was created:
| RSI (14): | 50.36 | |
| MACD (12,26,9): | 0.0000 | |
| Directional Movement: | 0.2374 | |
| AROON (14): | 28.5714 | |
| DEMA (21): | 0.0120 | |
| Parabolic SAR (0,02-0,02-0,2): | 0.0132 | |
| Elder Ray (13): | -0.0003 | |
| Super Trend (3,10): | 0.0100 | |
| Zig ZAG (10): | 0.0120 | |
| VORTEX (21): | 0.9103 | |
| Stochastique (14,3,5): | 28.18 | |
| TEMA (21): | 0.0120 | |
| Williams %R (14): | -70.00 | |
| Chande Momentum Oscillator (20): | -0.0008 | |
| Repulse (5,40,3): | 4.7592 | |
| ROCnROLL: | 1 | |
| TRIX (15,9): | 0.0813 | |
| Courbe Coppock: | 4.04 |
| MA7: | 0.0120 | |
| MA20: | 0.0120 | |
| MA50: | 0.0118 | |
| MA100: | 0.0123 | |
| MAexp7: | 0.0120 | |
| MAexp20: | 0.0120 | |
| MAexp50: | 0.0120 | |
| MAexp100: | 0.0118 | |
| Price / MA7: | -0% | |
| Price / MA20: | -0% | |
| Price / MA50: | +1.69% | |
| Price / MA100: | -2.44% | |
| Price / MAexp7: | -0% | |
| Price / MAexp20: | -0% | |
| Price / MAexp50: | -0% | |
| Price / MAexp100: | +1.69% |
News
The last news published on CRESCENT at the time of the generation of this analysis was as follows:
About author
Online


Add a comment
Comments
0 comments on the analysis CRESCENT - Daily