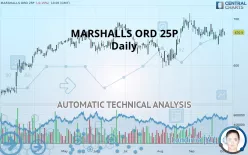
MARSHALLS ORD 25P - Daily - Technical analysis published on 10/02/2019 (GMT)
- 273
- 0
- Who voted?
Click here for a new analysis!
- Timeframe : Daily
- - Analysis generated on
- Status : INVALID

Summary of the analysis

Additional analysis
Quotes
MARSHALLS ORD 25P rating 670.5 GBX. The price registered a decrease of -0.15% on the session and was traded between 663.0 GBX and 673.5 GBX over the period. The price is currently at +1.13% from its lowest and -0.45% from its highest.A bearish opening was detected by the Central Gaps scanner. Sellers are trying to impose a bearish trend in the very short term.
Bearish opening
Type : Bearish
Timeframe : Openning
Here is a more detailed summary of the historical variations registered by MARSHALLS ORD 25P:
Near a new HIGH record (5 years)
Type : Bullish
Timeframe : Weekly
Near a new LOW record (1 month)
Type : Bearish
Timeframe : Weekly
Technical
Technical analysis of this Daily chart of MARSHALLS ORD 25P indicates that the overall trend is strongly bullish. The signals given by moving averages are 89.29% bullish. This strongly bullish trend seems to be running out of steam given the signals being given by short-term moving averages. The Central Indicators scanner detects bullish signals on moving averages that could impact this trend:
Bullish trend reversal : adaptative moving average 20
Type : Bullish
Timeframe : Daily
Bullish price crossover with Moving Average 20
Type : Bullish
Timeframe : Daily
Bullish price crossover with adaptative moving average 20
Type : Bullish
Timeframe : Daily
Technical indicators are slightly bullish. There is therefore considerable uncertainty about the continuation of the increase.
But beware of excesses. The Central Indicators scanner currently detects this:
Williams %R indicator is overbought : over -20
Type : Neutral
Timeframe : Daily
RSI indicator is back over 50
Type : Bullish
Timeframe : Daily
Parabolic SAR indicator bullish reversal
Type : Bullish
Timeframe : Daily
Price is back over the pivot point
Type : Bullish
Timeframe : Weekly
Williams %R indicator is back over -50
Type : Bullish
Timeframe : Daily
An analysis of the price chart with the Central Patterns scanner (detector of chart patterns and resistances and supports) shows a result that can have an impact on the price change:
Near horizontal support
Type : Bullish
Timeframe : Daily
The Central Candlesticks scanner which studies Japanese candlesticks did not detect anything.
| S3 | S2 | S1 | Price | R1 | |
|---|---|---|---|---|---|
| ProTrendLines | 605.5 | 630.4 | 663.2 | 670.5 | 696.0 |
| Change (%) | -9.69% | -5.98% | -1.09% | - | +3.80% |
| Change | -65.0 | -40.1 | -7.3 | - | +25.5 |
| Level | Major | Intermediate | Major | - | Major |
To determine price objectives, it is also possible to use the pivot points. Here is the price position in relation to pivot points:
| Pivot points | S3 | S2 | S1 | PP | R1 | R2 | R3 |
|---|---|---|---|---|---|---|---|
| Standard | 644.7 | 652.8 | 662.2 | 670.3 | 679.7 | 687.8 | 697.2 |
| Camarilla | 666.7 | 668.3 | 669.9 | 671.5 | 673.1 | 674.7 | 676.3 |
| Woodie | 645.3 | 653.1 | 662.8 | 670.6 | 680.3 | 688.1 | 697.8 |
| Fibonacci | 652.8 | 659.5 | 663.7 | 670.3 | 677.0 | 681.2 | 687.8 |
| Pivot points | S3 | S2 | S1 | PP | R1 | R2 | R3 |
|---|---|---|---|---|---|---|---|
| Standard | 616.8 | 630.7 | 648.8 | 662.7 | 680.8 | 694.7 | 712.8 |
| Camarilla | 658.2 | 661.1 | 664.1 | 667.0 | 669.9 | 672.9 | 675.8 |
| Woodie | 619.0 | 631.8 | 651.0 | 663.8 | 683.0 | 695.8 | 715.0 |
| Fibonacci | 630.7 | 642.9 | 650.4 | 662.7 | 674.9 | 682.4 | 694.7 |
| Pivot points | S3 | S2 | S1 | PP | R1 | R2 | R3 |
|---|---|---|---|---|---|---|---|
| Standard | 586.2 | 615.3 | 638.7 | 667.8 | 691.2 | 720.3 | 743.7 |
| Camarilla | 647.6 | 652.4 | 657.2 | 662.0 | 666.8 | 671.6 | 676.4 |
| Woodie | 583.3 | 613.9 | 635.8 | 666.4 | 688.3 | 718.9 | 740.8 |
| Fibonacci | 615.3 | 635.4 | 647.8 | 667.8 | 687.9 | 700.3 | 720.3 |
Numerical data
The following is the status of technical indicators and moving averages registered at the time this technical analysis was created:
| RSI (14): | 51.80 | |
| MACD (12,26,9): | 0.8000 | |
| Directional Movement: | 3.8 | |
| AROON (14): | -35.7 | |
| DEMA (21): | 669.8 | |
| Parabolic SAR (0,02-0,02-0,2): | 645.2 | |
| Elder Ray (13): | 0.5 | |
| Super Trend (3,10): | 647.2 | |
| Zig ZAG (10): | 669.5 | |
| VORTEX (21): | 1.0000 | |
| Stochastique (14,3,5): | 53.40 | |
| TEMA (21): | 666.7 | |
| Williams %R (14): | -39.80 | |
| Chande Momentum Oscillator (20): | -0.5 | |
| Repulse (5,40,3): | 0.4000 | |
| ROCnROLL: | 1 | |
| TRIX (15,9): | 0.0000 | |
| Courbe Coppock: | 1.40 |
| MA7: | 665.4 | |
| MA20: | 668.9 | |
| MA50: | 657.1 | |
| MA100: | 654.0 | |
| MAexp7: | 667.7 | |
| MAexp20: | 667.7 | |
| MAexp50: | 661.7 | |
| MAexp100: | 644.7 | |
| Price / MA7: | +0.77% | |
| Price / MA20: | +0.24% | |
| Price / MA50: | +2.04% | |
| Price / MA100: | +2.52% | |
| Price / MAexp7: | +0.42% | |
| Price / MAexp20: | +0.42% | |
| Price / MAexp50: | +1.33% | |
| Price / MAexp100: | +4.00% |
News
The last news published on MARSHALLS ORD 25P at the time of the generation of this analysis was as follows:
 Marshalls Plc
About author

Online


Add a comment
Comments
0 comments on the analysis MARSHALLS ORD 25P - Daily