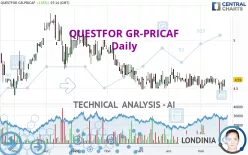
QUESTFOR GR-PRICAF - Daily - Technical analysis published on 05/24/2024 (GMT)
- 121
- 0
- Timeframe : Daily
- - Analysis generated on
- Status : NEUTRAL

Summary of the analysis

Additional analysis
Quotes
The QUESTFOR GR-PRICAF rating is 4.59 EUR. The price registered an increase of +1.55% on the session and was between 4.52 EUR and 4.59 EUR. This implies that the price is at +1.55% from its lowest and at 0% from its highest.A study of price movements over other periods shows the following variations:
Near a new LOW record (1 year)
Type : Bearish
Timeframe : Weekly
Near a new LOW record (1st january)
Type : Bearish
Timeframe : Weekly
Near a new HIGH record (1 month)
Type : Bullish
Timeframe : Weekly
Technical
Technical analysis of QUESTFOR GR-PRICAF in Daily shows an overall slightly bearish trend. Only 57.14% of the signals given by moving averages are bearish. This slightly bearish trend could turn neutral or reverse given the slightly bullish signals currently being given by short-term moving averages. The Central Indicators scanner detects bullish signals on moving averages that could impact this trend:
Bullish price crossover with Moving Average 20
Type : Bullish
Timeframe : Daily
Bullish price crossover with Moving Average 50
Type : Bullish
Timeframe : Daily
An assessment of technical indicators shows a slightly bullish signal.
Caution: the Central Indicators scanner currently detects an excess:
CCI indicator is oversold : under -100
Type : Neutral
Timeframe : Daily
Pivot points : price is over resistance 1
Type : Neutral
Timeframe : Daily
The Central Patterns scanner, which studies chart patterns, resistances and supports, has identified this signal:
Near support of channel
Type : Bullish
Timeframe : Daily
The Central Candlesticks scanner currently notes the presence of this pattern in Japanese candlesticks that could mark the end of the short-term trend currently underway:
Doji
Type : Neutral
Timeframe : Daily
| S3 | S2 | S1 | Price | R1 | R2 | R3 | |
|---|---|---|---|---|---|---|---|
| ProTrendLines | 2.51 | 3.45 | 4.51 | 4.59 | 4.65 | 4.95 | 5.20 |
| Change (%) | -45.32% | -24.84% | -1.74% | - | +1.31% | +7.84% | +13.29% |
| Change | -2.08 | -1.14 | -0.08 | - | +0.06 | +0.36 | +0.61 |
| Level | Minor | Major | Intermediate | - | Major | Minor | Intermediate |
Attention could also be paid to pivot points to set price objectives:
| Pivot points | S3 | S2 | S1 | PP | R1 | R2 | R3 |
|---|---|---|---|---|---|---|---|
| Standard | 4.36 | 4.42 | 4.47 | 4.53 | 4.58 | 4.64 | 4.69 |
| Camarilla | 4.49 | 4.50 | 4.51 | 4.52 | 4.53 | 4.54 | 4.55 |
| Woodie | 4.36 | 4.42 | 4.47 | 4.53 | 4.58 | 4.64 | 4.69 |
| Fibonacci | 4.42 | 4.46 | 4.49 | 4.53 | 4.57 | 4.60 | 4.64 |
| Pivot points | S3 | S2 | S1 | PP | R1 | R2 | R3 |
|---|---|---|---|---|---|---|---|
| Standard | 4.46 | 4.50 | 4.55 | 4.59 | 4.64 | 4.68 | 4.73 |
| Camarilla | 4.58 | 4.58 | 4.59 | 4.60 | 4.61 | 4.62 | 4.63 |
| Woodie | 4.47 | 4.50 | 4.56 | 4.59 | 4.65 | 4.68 | 4.74 |
| Fibonacci | 4.50 | 4.53 | 4.56 | 4.59 | 4.62 | 4.65 | 4.68 |
| Pivot points | S3 | S2 | S1 | PP | R1 | R2 | R3 |
|---|---|---|---|---|---|---|---|
| Standard | 4.25 | 4.38 | 4.46 | 4.59 | 4.67 | 4.80 | 4.88 |
| Camarilla | 4.48 | 4.50 | 4.52 | 4.54 | 4.56 | 4.58 | 4.60 |
| Woodie | 4.23 | 4.37 | 4.44 | 4.58 | 4.65 | 4.79 | 4.86 |
| Fibonacci | 4.38 | 4.46 | 4.51 | 4.59 | 4.67 | 4.72 | 4.80 |
Numerical data
The following are the details of the technical indicators and moving averages that were collected to generate this technical analysis:
| RSI (14): | 52.09 | |
| MACD (12,26,9): | -0.0100 | |
| Directional Movement: | -5.96 | |
| AROON (14): | -42.86 | |
| DEMA (21): | 4.55 | |
| Parabolic SAR (0,02-0,02-0,2): | 4.59 | |
| Elder Ray (13): | -0.01 | |
| Super Trend (3,10): | 4.71 | |
| Zig ZAG (10): | 4.59 | |
| VORTEX (21): | 0.9300 | |
| Stochastique (14,3,5): | 57.41 | |
| TEMA (21): | 4.56 | |
| Williams %R (14): | -22.22 | |
| Chande Momentum Oscillator (20): | -0.01 | |
| Repulse (5,40,3): | 1.3400 | |
| ROCnROLL: | -1 | |
| TRIX (15,9): | -0.0200 | |
| Courbe Coppock: | 0.26 |
| MA7: | 4.56 | |
| MA20: | 4.56 | |
| MA50: | 4.57 | |
| MA100: | 4.68 | |
| MAexp7: | 4.56 | |
| MAexp20: | 4.56 | |
| MAexp50: | 4.59 | |
| MAexp100: | 4.67 | |
| Price / MA7: | +0.66% | |
| Price / MA20: | +0.66% | |
| Price / MA50: | +0.44% | |
| Price / MA100: | -1.92% | |
| Price / MAexp7: | +0.66% | |
| Price / MAexp20: | +0.66% | |
| Price / MAexp50: | -0% | |
| Price / MAexp100: | -1.71% |
About author
Online


Add a comment
Comments
0 comments on the analysis QUESTFOR GR-PRICAF - Daily