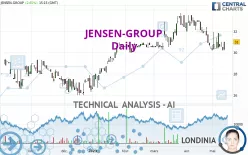
JENSEN-GROUP - Daily - Technical analysis published on 05/15/2023 (GMT)
- 153
- 0
Click here for a new analysis!
- Timeframe : Daily
- - Analysis generated on
- Status : TARGET REACHED

Summary of the analysis

Additional analysis
Quotes
JENSEN-GROUP rating 31.0 EUR. The price registered an increase of +2.65% on the session and was between 30.2 EUR and 31.0 EUR. This implies that the price is at +2.65% from its lowest and at 0% from its highest.The Central Gaps scanner detects a bullish opening. A small advantage for buyers in the very short term.
Bullish opening
Type : Bullish
Timeframe : Openning
So that you have an overall view of the price change, here is a table showing the variations over several periods:
New LOW record (1 month)
Type : Bearish
Timeframe : Weekly
Technical
Technical analysis of JENSEN-GROUP in Daily shows a neutral overall trend. The trend could quickly turn bearish due to the strong bearish signals currently being given by short-term moving averages. The Central Indicators scanner detects bullish signals on moving averages that could impact this trend:
Bullish price crossover with Moving Average 100
Type : Bullish
Timeframe : Daily
Bullish price crossover with adaptative moving average 100
Type : Bullish
Timeframe : Daily
On the 18 technical indicators analysed, 6 are bullish, 7 are neutral and 5 are bearish. Caution: the Central Indicators scanner currently detects an excess:
MACD indicator: bullish divergence
Type : Bullish
Timeframe : Daily
Pivot points : price is over resistance 3
Type : Neutral
Timeframe : Daily
Central Patterns, the market scanner focusing on chart patterns, resistances and supports found this result:
Near support of channel
Type : Bullish
Timeframe : Daily
The Central Candlesticks scanner which studies Japanese candlesticks did not detect anything.
| S3 | S2 | S1 | Price | R1 | R2 | R3 | |
|---|---|---|---|---|---|---|---|
| ProTrendLines | 28.0 | 28.9 | 30.5 | 31.0 | 31.9 | 33.4 | 34.9 |
| Change (%) | -9.68% | -6.77% | -1.61% | - | +2.90% | +7.74% | +12.58% |
| Change | -3.0 | -2.1 | -0.5 | - | +0.9 | +2.4 | +3.9 |
| Level | Minor | Major | Major | - | Major | Major | Minor |
Attention could also be paid to pivot points to set price objectives:
| Pivot points | S3 | S2 | S1 | PP | R1 | R2 | R3 |
|---|---|---|---|---|---|---|---|
| Standard | 29.7 | 29.9 | 30.5 | 30.7 | 31.3 | 31.5 | 32.1 |
| Camarilla | 30.8 | 30.9 | 30.9 | 31.0 | 31.1 | 31.2 | 31.2 |
| Woodie | 29.8 | 30.0 | 30.6 | 30.8 | 31.4 | 31.6 | 32.2 |
| Fibonacci | 29.9 | 30.2 | 30.4 | 30.7 | 31.0 | 31.2 | 31.5 |
| Pivot points | S3 | S2 | S1 | PP | R1 | R2 | R3 |
|---|---|---|---|---|---|---|---|
| Standard | 28.5 | 29.3 | 30.2 | 31.0 | 31.9 | 32.7 | 33.6 |
| Camarilla | 30.5 | 30.7 | 30.8 | 31.0 | 31.2 | 31.3 | 31.5 |
| Woodie | 28.5 | 29.3 | 30.2 | 31.0 | 31.9 | 32.7 | 33.6 |
| Fibonacci | 29.3 | 30.0 | 30.4 | 31.0 | 31.7 | 32.1 | 32.7 |
| Pivot points | S3 | S2 | S1 | PP | R1 | R2 | R3 |
|---|---|---|---|---|---|---|---|
| Standard | 26.3 | 28.3 | 29.4 | 31.4 | 32.5 | 34.5 | 35.6 |
| Camarilla | 29.6 | 29.8 | 30.1 | 30.4 | 30.7 | 31.0 | 31.3 |
| Woodie | 25.8 | 28.1 | 28.9 | 31.2 | 32.0 | 34.3 | 35.1 |
| Fibonacci | 28.3 | 29.5 | 30.3 | 31.4 | 32.6 | 33.4 | 34.5 |
Numerical data
The following are the details of the technical indicators and moving averages that were collected to generate this technical analysis:
| RSI (14): | 47.30 | |
| MACD (12,26,9): | -0.3000 | |
| Directional Movement: | 14.7 | |
| AROON (14): | -28.6 | |
| DEMA (21): | 30.8 | |
| Parabolic SAR (0,02-0,02-0,2): | 31.8 | |
| Elder Ray (13): | -0.4 | |
| Super Trend (3,10): | 32.0 | |
| Zig ZAG (10): | 31.0 | |
| VORTEX (21): | 0.7000 | |
| Stochastique (14,3,5): | 18.20 | |
| TEMA (21): | 30.4 | |
| Williams %R (14): | -63.60 | |
| Chande Momentum Oscillator (20): | -0.6 | |
| Repulse (5,40,3): | 3.5000 | |
| ROCnROLL: | -1 | |
| TRIX (15,9): | -0.1000 | |
| Courbe Coppock: | 8.50 |
| MA7: | 30.8 | |
| MA20: | 31.4 | |
| MA50: | 31.6 | |
| MA100: | 30.3 | |
| MAexp7: | 30.8 | |
| MAexp20: | 31.2 | |
| MAexp50: | 31.3 | |
| MAexp100: | 30.7 | |
| Price / MA7: | +0.65% | |
| Price / MA20: | -1.27% | |
| Price / MA50: | -1.90% | |
| Price / MA100: | +2.31% | |
| Price / MAexp7: | +0.65% | |
| Price / MAexp20: | -0.64% | |
| Price / MAexp50: | -0.96% | |
| Price / MAexp100: | +0.98% |
News
The latest news and videos published on JENSEN-GROUP at the time of the analysis were as follows:
About author
Online


Add a comment
Comments
0 comments on the analysis JENSEN-GROUP - Daily