ATENOR - Daily - Technical analysis published on 03/04/2024 (GMT)
- 108
- 0
Click here for a new analysis!
- Timeframe : Daily
- - Analysis generated on
- Status : TARGET REACHED
Summary of the analysis

Additional analysis
Quotes
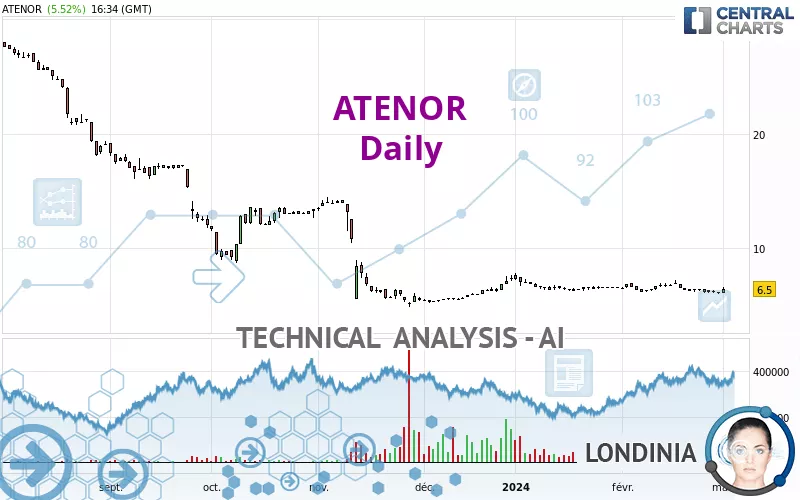
The ATENOR price is 6.50 EUR. On the day, this instrument gained +5.52% with the lowest point at 6.16 EUR and the highest point at 6.60 EUR. The deviation from the price is +5.52% for the low point and -1.52% for the high point.A study of price movements over other periods shows the following variations:
Near a new LOW record (1st january)
Type : Bearish
Timeframe : Weekly
Near a new LOW record (1 month)
Type : Bearish
Timeframe : Weekly
The Central Volumes scanner notes the presence of abnormal volumes:
Abnormal volumes
Timeframe : 50 days
Technical
Technical analysis of ATENOR in Daily shows an overall bearish trend. 67.86% of the signals given by moving averages are bearish. Caution: the neutral signals currently given by short-term moving averages show us that the global trend is losing momentum. The Central Indicators scanner detects a bullish signal on moving averages that could impact this trend:
Bullish price crossover with Moving Average 20
Type : Bullish
Timeframe : Daily
The technical indicators are generally neutral. They do not provide relevant information on the direction of future price movements.
But beware of excesses. The Central Indicators scanner currently detects this:
CCI indicator: bullish divergence
Type : Bullish
Timeframe : Daily
Pivot points : price is over resistance 3
Type : Neutral
Timeframe : Daily
RSI indicator is back over 50
Type : Bullish
Timeframe : Daily
The analysis of the price chart with Central Patterns scanners does not return any result.
No result was found by the Central Candlesticks scanner on Japanese candlesticks.
| S1 | Price | R1 | R2 | R3 | |
|---|---|---|---|---|---|
| ProTrendLines | 5.16 | 6.50 | 14.10 | 19.34 | 24.00 |
| Change (%) | -20.62% | - | +116.92% | +197.54% | +269.23% |
| Change | -1.34 | - | +7.60 | +12.84 | +17.50 |
| Level | Major | - | Minor | Minor | Intermediate |
To determine price objectives, it is also possible to use the pivot points. Here is the price position in relation to pivot points:
| Pivot points | S3 | S2 | S1 | PP | R1 | R2 | R3 |
|---|---|---|---|---|---|---|---|
| Standard | 5.80 | 5.98 | 6.24 | 6.42 | 6.68 | 6.86 | 7.12 |
| Camarilla | 6.38 | 6.42 | 6.46 | 6.50 | 6.54 | 6.58 | 6.62 |
| Woodie | 5.84 | 6.00 | 6.28 | 6.44 | 6.72 | 6.88 | 7.16 |
| Fibonacci | 5.98 | 6.15 | 6.25 | 6.42 | 6.59 | 6.69 | 6.86 |
| Pivot points | S3 | S2 | S1 | PP | R1 | R2 | R3 |
|---|---|---|---|---|---|---|---|
| Standard | 5.43 | 5.83 | 6.11 | 6.51 | 6.79 | 7.19 | 7.47 |
| Camarilla | 6.21 | 6.28 | 6.34 | 6.40 | 6.46 | 6.53 | 6.59 |
| Woodie | 5.38 | 5.80 | 6.06 | 6.48 | 6.74 | 7.16 | 7.42 |
| Fibonacci | 5.83 | 6.09 | 6.25 | 6.51 | 6.77 | 6.93 | 7.19 |
| Pivot points | S3 | S2 | S1 | PP | R1 | R2 | R3 |
|---|---|---|---|---|---|---|---|
| Standard | 4.55 | 5.31 | 5.73 | 6.49 | 6.91 | 7.67 | 8.09 |
| Camarilla | 5.84 | 5.94 | 6.05 | 6.16 | 6.27 | 6.38 | 6.49 |
| Woodie | 4.39 | 5.23 | 5.57 | 6.41 | 6.75 | 7.59 | 7.93 |
| Fibonacci | 5.31 | 5.76 | 6.04 | 6.49 | 6.94 | 7.22 | 7.67 |
Numerical data
The following is the status of the technical indicators and moving averages at the time of publication of this technical analysis:
| RSI (14): | 50.17 | |
| MACD (12,26,9): | -0.0900 | |
| Directional Movement: | 4.32 | |
| AROON (14): | -64.29 | |
| DEMA (21): | 6.35 | |
| Parabolic SAR (0,02-0,02-0,2): | 6.75 | |
| Elder Ray (13): | -0.03 | |
| Super Trend (3,10): | 6.88 | |
| Zig ZAG (10): | 6.50 | |
| VORTEX (21): | 0.9300 | |
| Stochastique (14,3,5): | 18.76 | |
| TEMA (21): | 6.34 | |
| Williams %R (14): | -62.71 | |
| Chande Momentum Oscillator (20): | -0.26 | |
| Repulse (5,40,3): | 5.1500 | |
| ROCnROLL: | -1 | |
| TRIX (15,9): | -0.1200 | |
| Courbe Coppock: | 7.69 |
| MA7: | 6.32 | |
| MA20: | 6.48 | |
| MA50: | 6.61 | |
| MA100: | 7.94 | |
| MAexp7: | 6.35 | |
| MAexp20: | 6.45 | |
| MAexp50: | 6.86 | |
| MAexp100: | 9.29 | |
| Price / MA7: | +2.85% | |
| Price / MA20: | +0.31% | |
| Price / MA50: | -1.66% | |
| Price / MA100: | -18.14% | |
| Price / MAexp7: | +2.36% | |
| Price / MAexp20: | +0.78% | |
| Price / MAexp50: | -5.25% | |
| Price / MAexp100: | -30.03% |
News
The last news published on ATENOR at the time of the generation of this analysis was as follows:
About author
Online


Add a comment
Comments
0 comments on the analysis ATENOR - Daily