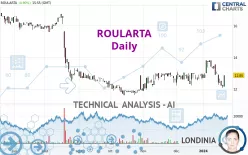
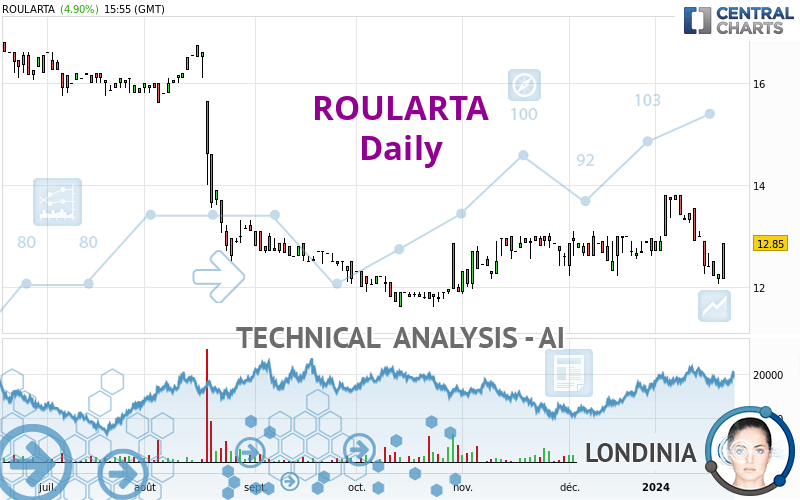
ROULARTA - Daily - Technical analysis published on 01/24/2024 (GMT)
- 98
- 0
Click here for a new analysis!
- Timeframe : Daily
- - Analysis generated on
- Status : INVALID
Summary of the analysis

Additional analysis
Quotes
The ROULARTA price is 12.85 EUR. On the day, this instrument gained +4.90% and was traded between 12.15 EUR and 12.85 EUR over the period. The price is currently at +5.76% from its lowest and 0% from its highest.Here is a more detailed summary of the historical variations registered by ROULARTA:
Near a new LOW record (1 year)
Type : Bearish
Timeframe : Weekly
Near a new LOW record (1st january)
Type : Bearish
Timeframe : Weekly
Near a new LOW record (1 month)
Type : Bearish
Timeframe : Weekly
Technical
A technical analysis in Daily of this ROULARTA chart shows a slightly bullish trend. 50.00% of the signals given by moving averages are bullish. The overall trend remains fragile, as do the slightly bullish signals given by short-term moving averages. The Central Indicators market scanner is currently detecting several bullish signals that could impact this trend:
Bullish price crossover with Moving Average 50
Type : Bullish
Timeframe : Daily
Bullish price crossover with Moving Average 100
Type : Bullish
Timeframe : Daily
Bullish price crossover with adaptative moving average 20
Type : Bullish
Timeframe : Daily
Bullish price crossover with adaptative moving average 50
Type : Bullish
Timeframe : Daily
Bullish price crossover with adaptative moving average 100
Type : Bullish
Timeframe : Daily
In fact, of the 18 technical indicators analysed by Central Analyzer, 7 are bullish, 6 are neutral and 5 are bearish. Other results related to technical indicators were also found by the Central Indicators scanner:
Pivot points : price is over resistance 3
Type : Neutral
Timeframe : Daily
RSI indicator is back over 50
Type : Bullish
Timeframe : Daily
Ichimoku : price is over the cloud
Type : Bullish
Timeframe : Daily
Price is back over the pivot point
Type : Bullish
Timeframe : Weekly
Central Patterns, the scanner specializing in chart patterns, did not identify any signals.
The Central Candlesticks scanner, specialised in Japanese candlesticks, did not identify any signals.
| S3 | S2 | S1 | Price | R1 | R2 | R3 | |
|---|---|---|---|---|---|---|---|
| ProTrendLines | 8.27 | 9.51 | 11.92 | 12.85 | 13.28 | 13.80 | 15.23 |
| Change (%) | -35.64% | -25.99% | -7.24% | - | +3.35% | +7.39% | +18.52% |
| Change | -4.58 | -3.34 | -0.93 | - | +0.43 | +0.95 | +2.38 |
| Level | Minor | Major | Major | - | Major | Minor | Major |
Pivot points can also be used to set your price objectives. Here is the price situation in relation to pivot points:
| Pivot points | S3 | S2 | S1 | PP | R1 | R2 | R3 |
|---|---|---|---|---|---|---|---|
| Standard | 11.68 | 11.92 | 12.38 | 12.62 | 13.08 | 13.32 | 13.78 |
| Camarilla | 12.66 | 12.72 | 12.79 | 12.85 | 12.91 | 12.98 | 13.04 |
| Woodie | 11.80 | 11.98 | 12.50 | 12.68 | 13.20 | 13.38 | 13.90 |
| Fibonacci | 11.92 | 12.18 | 12.35 | 12.62 | 12.88 | 13.05 | 13.32 |
| Pivot points | S3 | S2 | S1 | PP | R1 | R2 | R3 |
|---|---|---|---|---|---|---|---|
| Standard | 10.40 | 11.30 | 11.75 | 12.65 | 13.10 | 14.00 | 14.45 |
| Camarilla | 11.83 | 11.95 | 12.08 | 12.20 | 12.32 | 12.45 | 12.57 |
| Woodie | 10.18 | 11.19 | 11.53 | 12.54 | 12.88 | 13.89 | 14.23 |
| Fibonacci | 11.30 | 11.82 | 12.13 | 12.65 | 13.17 | 13.48 | 14.00 |
| Pivot points | S3 | S2 | S1 | PP | R1 | R2 | R3 |
|---|---|---|---|---|---|---|---|
| Standard | 11.33 | 11.77 | 12.23 | 12.67 | 13.13 | 13.57 | 14.03 |
| Camarilla | 12.45 | 12.54 | 12.62 | 12.70 | 12.78 | 12.87 | 12.95 |
| Woodie | 11.35 | 11.78 | 12.25 | 12.68 | 13.15 | 13.58 | 14.05 |
| Fibonacci | 11.77 | 12.11 | 12.32 | 12.67 | 13.01 | 13.22 | 13.57 |
Numerical data
The following are the details of the technical indicators and moving averages that were collected to generate this technical analysis:
| RSI (14): | 50.10 | |
| MACD (12,26,9): | -0.0800 | |
| Directional Movement: | -8.97 | |
| AROON (14): | -78.57 | |
| DEMA (21): | 12.79 | |
| Parabolic SAR (0,02-0,02-0,2): | 13.58 | |
| Elder Ray (13): | -0.28 | |
| Super Trend (3,10): | 13.17 | |
| Zig ZAG (10): | 12.85 | |
| VORTEX (21): | 0.9000 | |
| Stochastique (14,3,5): | 19.05 | |
| TEMA (21): | 12.63 | |
| Williams %R (14): | -54.29 | |
| Chande Momentum Oscillator (20): | -0.95 | |
| Repulse (5,40,3): | 5.0100 | |
| ROCnROLL: | -1 | |
| TRIX (15,9): | 0.0400 | |
| Courbe Coppock: | 5.05 |
| MA7: | 12.57 | |
| MA20: | 12.94 | |
| MA50: | 12.84 | |
| MA100: | 12.58 | |
| MAexp7: | 12.64 | |
| MAexp20: | 12.84 | |
| MAexp50: | 12.83 | |
| MAexp100: | 13.14 | |
| Price / MA7: | +2.23% | |
| Price / MA20: | -0.70% | |
| Price / MA50: | +0.08% | |
| Price / MA100: | +2.15% | |
| Price / MAexp7: | +1.66% | |
| Price / MAexp20: | +0.08% | |
| Price / MAexp50: | +0.16% | |
| Price / MAexp100: | -2.21% |
News
The latest news and videos published on ROULARTA at the time of the analysis were as follows:
- ROULARTA MEDIA GROUP is to attend the Smallcap Event 2019 April 16 & 17 in Paris
-
 Roularta Media Group
-
Roularta Media Group
About author
Online


Add a comment
Comments
0 comments on the analysis ROULARTA - Daily