RECTICEL
-
EUR
(-)
- 15 min delayed data - Euronext Bruxelles
| Open: | - |
| Change: | - |
| Volume: | - |
| Low: | - |
| High: | - |
| High / Low range: | - |
| Type: | Stocks |
| Ticker: | RECT |
| ISIN: | BE0003656676 |
RECTICEL overview
RECTICEL
> Analyses01/29/2024 - 14:25

 Thank you
Reply
Chart
Thank you
Reply
Chart
Londinia
has published a new analysis.
- 0
- 94k
- 15.8k
- 0
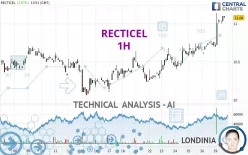
Timeframe : 1H - Simple chart
Status : TARGET REACHED
All elements being clearly bullish, it would be possible for traders to trade only long positions (at the time of purchase) on RECTICEL as long as the price remains well above 10.77 EUR. The buyers'…
RECTICEL
> Analyses10/10/2023 - 06:30
 Thank you
Reply
Chart
Thank you
Reply
Chart
Londinia
has published a new analysis.
- 0
- 94k
- 15.8k
- 0
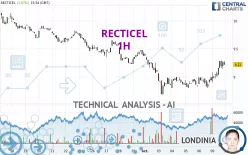
Timeframe : 1H - Simple chart
Status : TARGET REACHED
The bullish trend is truly tentative and does not seem to be supported in the short term. It is advisable to trade RECTICEL with the greatest caution, while favouring long positions (at the time of…
RECTICEL
> Analyses09/01/2023 - 10:35
 Thank you
Reply
Chart
Thank you
Reply
Chart
Londinia
has published a new analysis.
- 0
- 94k
- 15.8k
- 0
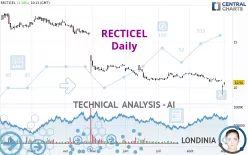
Timeframe : Daily - Simple chart
Status : TARGET REACHED
All elements being clearly bearish, it would be possible for traders to trade only short positions (for sale) on RECTICEL as long as the price remains well below 11.48 EUR. The sellers' bearish…
RECTICEL
> Analyses09/28/2022 - 06:35
 Thank you
Reply
Chart
Thank you
Reply
Chart
Londinia
has published a new analysis.
- 0
- 94k
- 15.8k
- 0
Timeframe : Daily - Simple chart
Status : INVALID
The bearish trend is currently very strong for RECTICEL. As long as the price remains below the resistance at 14.02 EUR, you could try to take advantage of the bearish rally. The first bearish…


