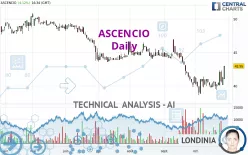
ASCENCIO - Daily - Technical analysis published on 10/30/2023 (GMT)
- 152
- 0
Click here for a new analysis!
- Timeframe : Daily
- - Analysis generated on
- Status : TARGET REACHED

Summary of the analysis

Additional analysis
Quotes
The ASCENCIO rating is 42.95 EUR. On the day, this instrument gained +4.12% and was traded between 41.00 EUR and 43.00 EUR over the period. The price is currently at +4.76% from its lowest and -0.12% from its highest.A study of price movements over other periods shows the following variations:
New HIGH record (1 month)
Type : Bullish
Timeframe : Weekly
Technical
Technical analysis of this Daily chart of ASCENCIO indicates that the overall trend is slightly bearish. 57.14% of the signals given by moving averages are bearish. Caution: the strong bullish signals currently being given by short-term moving averages indicate that this slightly bearish trend could quickly be reversed. The Central Indicators market scanner is currently detecting several bullish signals that could impact this trend:
Bullish price crossover with Moving Average 50
Type : Bullish
Timeframe : Daily
Bullish price crossover with adaptative moving average 50
Type : Bullish
Timeframe : Daily
Bullish price crossover with adaptative moving average 100
Type : Bullish
Timeframe : Daily
In fact, 13 technical indicators on 18 studied are currently bullish. Caution: the Central Indicators scanner currently detects an excess:
CCI indicator is overbought : over 100
Type : Neutral
Timeframe : Daily
Williams %R indicator is overbought : over -20
Type : Neutral
Timeframe : Daily
Pivot points : price is over resistance 3
Type : Neutral
Timeframe : Daily
Pivot points : price is over resistance 3
Type : Neutral
Timeframe : Weekly
The Central Patterns scanner, which studies chart patterns, resistances and supports, has identified these signals:
Near resistance of channel
Type : Bearish
Timeframe : Daily
Near resistance of triangle
Type : Bearish
Timeframe : Daily
The Central Candlesticks scanner which studies Japanese candlesticks did not detect anything.
| S3 | S2 | S1 | Price | R1 | R2 | R3 | |
|---|---|---|---|---|---|---|---|
| ProTrendLines | 38.31 | 40.65 | 41.98 | 42.95 | 43.55 | 45.04 | 47.94 |
| Change (%) | -10.80% | -5.36% | -2.26% | - | +1.40% | +4.87% | +11.62% |
| Change | -4.64 | -2.30 | -0.97 | - | +0.60 | +2.09 | +4.99 |
| Level | Major | Intermediate | Major | - | Minor | Intermediate | Intermediate |
Pivot points can also be used to set your price objectives. Here is the price situation in relation to pivot points:
| Pivot points | S3 | S2 | S1 | PP | R1 | R2 | R3 |
|---|---|---|---|---|---|---|---|
| Standard | 39.63 | 40.32 | 41.63 | 42.32 | 43.63 | 44.32 | 45.63 |
| Camarilla | 42.40 | 42.58 | 42.77 | 42.95 | 43.13 | 43.32 | 43.50 |
| Woodie | 39.95 | 40.48 | 41.95 | 42.48 | 43.95 | 44.48 | 45.95 |
| Fibonacci | 40.32 | 41.08 | 41.55 | 42.32 | 43.08 | 43.55 | 44.32 |
| Pivot points | S3 | S2 | S1 | PP | R1 | R2 | R3 |
|---|---|---|---|---|---|---|---|
| Standard | 38.27 | 38.83 | 39.52 | 40.08 | 40.77 | 41.33 | 42.02 |
| Camarilla | 39.86 | 39.97 | 40.09 | 40.20 | 40.32 | 40.43 | 40.54 |
| Woodie | 38.33 | 38.86 | 39.58 | 40.11 | 40.83 | 41.36 | 42.08 |
| Fibonacci | 38.83 | 39.31 | 39.61 | 40.08 | 40.56 | 40.86 | 41.33 |
| Pivot points | S3 | S2 | S1 | PP | R1 | R2 | R3 |
|---|---|---|---|---|---|---|---|
| Standard | 31.27 | 35.53 | 38.42 | 42.68 | 45.57 | 49.83 | 52.72 |
| Camarilla | 39.33 | 39.99 | 40.65 | 41.30 | 41.96 | 42.61 | 43.27 |
| Woodie | 30.58 | 35.19 | 37.73 | 42.34 | 44.88 | 49.49 | 52.03 |
| Fibonacci | 35.53 | 38.27 | 39.95 | 42.68 | 45.42 | 47.10 | 49.83 |
Numerical data
The following is the status of the technical indicators and moving averages at the time of publication of this technical analysis:
| RSI (14): | 58.95 | |
| MACD (12,26,9): | -0.1900 | |
| Directional Movement: | 10.58 | |
| AROON (14): | 35.71 | |
| DEMA (21): | 40.68 | |
| Parabolic SAR (0,02-0,02-0,2): | 39.52 | |
| Elder Ray (13): | 0.90 | |
| Super Trend (3,10): | 38.47 | |
| Zig ZAG (10): | 42.95 | |
| VORTEX (21): | 1.0200 | |
| Stochastique (14,3,5): | 69.08 | |
| TEMA (21): | 41.18 | |
| Williams %R (14): | -1.39 | |
| Chande Momentum Oscillator (20): | 1.95 | |
| Repulse (5,40,3): | 8.3400 | |
| ROCnROLL: | 1 | |
| TRIX (15,9): | -0.2100 | |
| Courbe Coppock: | 4.13 |
| MA7: | 41.09 | |
| MA20: | 40.60 | |
| MA50: | 42.46 | |
| MA100: | 43.92 | |
| MAexp7: | 41.39 | |
| MAexp20: | 41.14 | |
| MAexp50: | 42.18 | |
| MAexp100: | 43.72 | |
| Price / MA7: | +4.53% | |
| Price / MA20: | +5.79% | |
| Price / MA50: | +1.15% | |
| Price / MA100: | -2.21% | |
| Price / MAexp7: | +3.77% | |
| Price / MAexp20: | +4.40% | |
| Price / MAexp50: | +1.83% | |
| Price / MAexp100: | -1.76% |
News
The latest news and videos published on ASCENCIO at the time of the analysis were as follows:
- Disclosure of transparency - Notification
- Press Release - Half-Yearly Financial Report
- Extraordinary General Meeting of 16 Juny 2023
- Interim statement at 31/12/2022 - First quarter of financial year 2022-2023
- Extraordinary General Meeting of 17 February 2023
About author
Online


Add a comment
Comments
0 comments on the analysis ASCENCIO - Daily