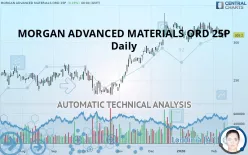
MORGAN ADVANCED MATERIALS ORD 25P - Daily - Technical analysis published on 02/13/2020 (GMT)
- 344
- 0
- Who voted?
Click here for a new analysis!
- Timeframe : Daily
- - Analysis generated on
- Status : INVALID

Summary of the analysis

Additional analysis
Quotes
MORGAN ADVANCED MATERIALS ORD 25P rating 309.2 GBX. On the day, this instrument lost +0.19% with the lowest point at 308.0 GBX and the highest point at 315.0 GBX. The deviation from the price is +0.39% for the low point and -1.84% for the high point.The Central Gaps scanner detects the formation of a bullish gap marking the strong presence of buyers against sellers at the opening. This formed a quotation gap.
Opening Gap UP
Type : Bullish
Timeframe : Openning
A study of price movements over other periods shows the following variations:
Technical
A technical analysis in Daily of this MORGAN ADVANCED MATERIALS ORD 25P chart shows a bullish trend. 67.86% of the signals given by moving averages are bullish. Caution: the slightly bearish signals currently being given by short-term moving averages indicate that this bullish trend may be running out of steam. The Central Indicators scanner detects bearish signals on moving averages that could impact this trend:
Bearish price crossover with Moving Average 50
Type : Bearish
Timeframe : Daily
Bearish price crossover with adaptative moving average 50
Type : Bearish
Timeframe : Daily
An assessment of technical indicators does not currently provide any relevant information on the direction of future price movements.
Caution: the Central Indicators scanner currently detects an excess:
CCI indicator is oversold : under -100
Type : Neutral
Timeframe : Daily
Williams %R indicator is oversold : under -80
Type : Neutral
Timeframe : Daily
RSI indicator is back under 50
Type : Bearish
Timeframe : Daily
Price is back under the pivot point
Type : Bearish
Timeframe : Daily
Price is back under the pivot point
Type : Bearish
Timeframe : Weekly
The analysis of the price chart with Central Patterns scanners does not return any result.
The Central Candlesticks scanner, specialised in Japanese candlesticks, did not identify any signals.
| S3 | S2 | S1 | Price | R1 | R2 | R3 | |
|---|---|---|---|---|---|---|---|
| ProTrendLines | 267.9 | 281.3 | 305.1 | 309.2 | 323.0 | 338.4 | 365.1 |
| Change (%) | -13.36% | -9.02% | -1.33% | - | +4.46% | +9.44% | +18.08% |
| Change | -41.3 | -27.9 | -4.1 | - | +13.8 | +29.2 | +55.9 |
| Level | Intermediate | Major | Major | - | Major | Intermediate | Major |
Attention could also be paid to pivot points to set price objectives:
| Pivot points | S3 | S2 | S1 | PP | R1 | R2 | R3 |
|---|---|---|---|---|---|---|---|
| Standard | 298.7 | 302.7 | 305.7 | 309.7 | 312.7 | 316.7 | 319.7 |
| Camarilla | 306.9 | 307.5 | 308.2 | 308.8 | 309.4 | 310.1 | 310.7 |
| Woodie | 298.3 | 302.5 | 305.3 | 309.5 | 312.3 | 316.5 | 319.3 |
| Fibonacci | 302.7 | 305.3 | 307.0 | 309.7 | 312.3 | 314.0 | 316.7 |
| Pivot points | S3 | S2 | S1 | PP | R1 | R2 | R3 |
|---|---|---|---|---|---|---|---|
| Standard | 290.3 | 300.1 | 306.1 | 315.9 | 321.9 | 331.7 | 337.7 |
| Camarilla | 307.7 | 309.1 | 310.6 | 312.0 | 313.5 | 314.9 | 316.3 |
| Woodie | 288.3 | 299.2 | 304.1 | 315.0 | 319.9 | 330.8 | 335.7 |
| Fibonacci | 300.1 | 306.2 | 309.9 | 315.9 | 322.0 | 325.7 | 331.7 |
| Pivot points | S3 | S2 | S1 | PP | R1 | R2 | R3 |
|---|---|---|---|---|---|---|---|
| Standard | 273.9 | 287.1 | 299.5 | 312.7 | 325.1 | 338.3 | 350.7 |
| Camarilla | 305.0 | 307.3 | 309.7 | 312.0 | 314.4 | 316.7 | 319.0 |
| Woodie | 273.6 | 286.9 | 299.2 | 312.5 | 324.8 | 338.1 | 350.4 |
| Fibonacci | 287.1 | 296.9 | 302.9 | 312.7 | 322.5 | 328.5 | 338.3 |
Numerical data
The following is the status of technical indicators and moving averages registered at the time this technical analysis was created:
| RSI (14): | 43.40 | |
| MACD (12,26,9): | 0.3000 | |
| Directional Movement: | 5.5 | |
| AROON (14): | -50.0 | |
| DEMA (21): | 314.0 | |
| Parabolic SAR (0,02-0,02-0,2): | 321.9 | |
| Elder Ray (13): | -0.9 | |
| Super Trend (3,10): | 295.4 | |
| Zig ZAG (10): | 307.0 | |
| VORTEX (21): | 1.0000 | |
| Stochastique (14,3,5): | 14.70 | |
| TEMA (21): | 309.8 | |
| Williams %R (14): | -97.90 | |
| Chande Momentum Oscillator (20): | -10.0 | |
| Repulse (5,40,3): | -6.4000 | |
| ROCnROLL: | -1 | |
| TRIX (15,9): | 0.1000 | |
| Courbe Coppock: | 3.00 |
| MA7: | 311.1 | |
| MA20: | 314.5 | |
| MA50: | 309.9 | |
| MA100: | 282.7 | |
| MAexp7: | 311.1 | |
| MAexp20: | 312.7 | |
| MAexp50: | 305.4 | |
| MAexp100: | 291.9 | |
| Price / MA7: | -0.61% | |
| Price / MA20: | -1.69% | |
| Price / MA50: | -0.23% | |
| Price / MA100: | +9.37% | |
| Price / MAexp7: | -0.61% | |
| Price / MAexp20: | -1.12% | |
| Price / MAexp50: | +1.24% | |
| Price / MAexp100: | +5.93% |
News
The latest news and videos published on MORGAN ADVANCED MATERIALS ORD 25P at the time of the analysis were as follows:
 Morgan Advanced Materials
About author

Online


Add a comment
Comments
0 comments on the analysis MORGAN ADVANCED MATERIALS ORD 25P - Daily