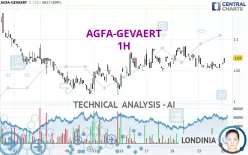
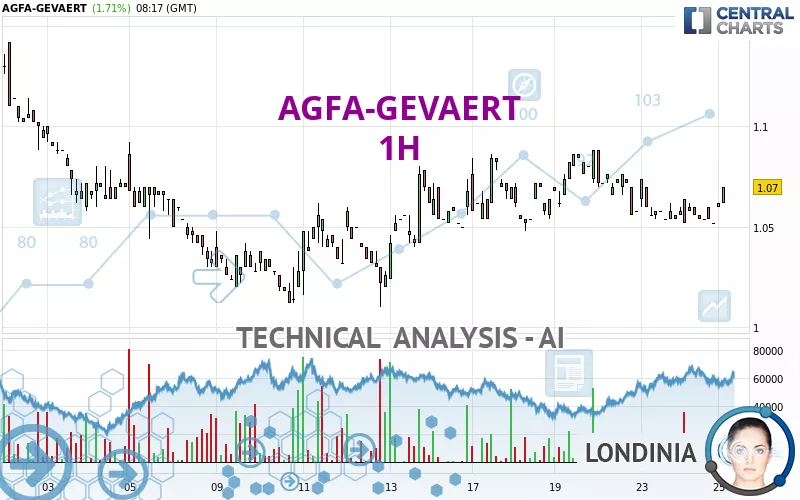
AGFA-GEVAERT - 1H - Technical analysis published on 09/25/2024 (GMT)
- 158
- 0
Click here for a new analysis!
- Timeframe : 1H
- - Analysis generated on
- Status : INVALID
Summary of the analysis

Additional analysis
Quotes
The AGFA-GEVAERT rating is 1.070 EUR. The price has increased by +1.71% since the last closing and was traded between 1.060 EUR and 1.070 EUR over the period. The price is currently at +0.94% from its lowest and 0% from its highest.The Central Gaps scanner detects a bullish opening. A small advantage for buyers in the very short term.
Bullish opening
Type : Bullish
Timeframe : Openning
Here is a more detailed summary of the historical variations registered by AGFA-GEVAERT:
Near a new LOW record (1 month)
Type : Bearish
Timeframe : Weekly
Technical
Technical analysis of this 1H chart of AGFA-GEVAERT indicates that the overall trend is bullish. 75.00% of the signals given by moving averages are bullish. This bullish trend shows slight signs of slowing down given the slightly bullish signals given by the short-term moving averages. The Central Indicators market scanner is currently detecting several bullish signals that could impact this trend:
Bullish trend reversal : adaptative moving average 20
Type : Bullish
Timeframe : 1 hour
Bullish trend reversal : adaptative moving average 50
Type : Bullish
Timeframe : 1 hour
Bullish price crossover with Moving Average 50
Type : Bullish
Timeframe : 1 hour
In fact, 11 technical indicators on 18 studied are currently bullish. But beware of excesses. The Central Indicators scanner currently detects this:
Williams %R indicator is overbought : over -20
Type : Neutral
Timeframe : 1 hour
Pivot points : price is over resistance 2
Type : Neutral
Timeframe : 1 hour
Price is back over the pivot point
Type : Bullish
Timeframe : Weekly
An analysis of the price chart with the Central Patterns scanner (detector of chart patterns and resistances and supports) shows a result that can have an impact on the price change:
Near resistance of channel
Type : Bearish
Timeframe : 1 hour
No result was found by the Central Candlesticks scanner on Japanese candlesticks.
| S2 | S1 | Price | R1 | R2 | R3 | |
|---|---|---|---|---|---|---|
| ProTrendLines | 1.012 | 1.048 | 1.070 | 1.086 | 1.125 | 1.170 |
| Change (%) | -5.42% | -2.06% | - | +1.50% | +5.14% | +9.35% |
| Change | -0.058 | -0.022 | - | +0.016 | +0.055 | +0.100 |
| Level | Major | Minor | - | Major | Minor | Major |
Attention could also be paid to pivot points to set price objectives:
| Pivot points | S3 | S2 | S1 | PP | R1 | R2 | R3 |
|---|---|---|---|---|---|---|---|
| Standard | 1.036 | 1.044 | 1.048 | 1.056 | 1.060 | 1.068 | 1.072 |
| Camarilla | 1.049 | 1.050 | 1.051 | 1.052 | 1.053 | 1.054 | 1.055 |
| Woodie | 1.034 | 1.043 | 1.046 | 1.055 | 1.058 | 1.067 | 1.070 |
| Fibonacci | 1.044 | 1.049 | 1.051 | 1.056 | 1.061 | 1.063 | 1.068 |
| Pivot points | S3 | S2 | S1 | PP | R1 | R2 | R3 |
|---|---|---|---|---|---|---|---|
| Standard | 1.001 | 1.025 | 1.041 | 1.065 | 1.081 | 1.105 | 1.121 |
| Camarilla | 1.047 | 1.051 | 1.054 | 1.058 | 1.062 | 1.065 | 1.069 |
| Woodie | 0.998 | 1.023 | 1.038 | 1.063 | 1.078 | 1.103 | 1.118 |
| Fibonacci | 1.025 | 1.040 | 1.049 | 1.065 | 1.080 | 1.089 | 1.105 |
| Pivot points | S3 | S2 | S1 | PP | R1 | R2 | R3 |
|---|---|---|---|---|---|---|---|
| Standard | 0.823 | 0.929 | 1.029 | 1.135 | 1.235 | 1.341 | 1.441 |
| Camarilla | 1.073 | 1.092 | 1.111 | 1.130 | 1.149 | 1.168 | 1.187 |
| Woodie | 0.821 | 0.928 | 1.027 | 1.134 | 1.233 | 1.340 | 1.439 |
| Fibonacci | 0.929 | 1.007 | 1.056 | 1.135 | 1.213 | 1.262 | 1.341 |
Numerical data
The following is the status of the technical indicators and moving averages at the time of publication of this technical analysis:
| RSI (14): | 55.63 | |
| MACD (12,26,9): | -0.0020 | |
| Directional Movement: | 22.854 | |
| AROON (14): | 57.143 | |
| DEMA (21): | 1.057 | |
| Parabolic SAR (0,02-0,02-0,2): | 1.052 | |
| Elder Ray (13): | 0.006 | |
| Super Trend (3,10): | 1.069 | |
| Zig ZAG (10): | 1.068 | |
| VORTEX (21): | 0.8210 | |
| Stochastique (14,3,5): | 61.11 | |
| TEMA (21): | 1.056 | |
| Williams %R (14): | 0.00 | |
| Chande Momentum Oscillator (20): | 0.014 | |
| Repulse (5,40,3): | 0.5720 | |
| ROCnROLL: | 1 | |
| TRIX (15,9): | -0.0450 | |
| Courbe Coppock: | 0.43 |
| MA7: | 1.066 | |
| MA20: | 1.066 | |
| MA50: | 1.103 | |
| MA100: | 1.138 | |
| MAexp7: | 1.060 | |
| MAexp20: | 1.060 | |
| MAexp50: | 1.062 | |
| MAexp100: | 1.063 | |
| Price / MA7: | +0.38% | |
| Price / MA20: | +0.38% | |
| Price / MA50: | -2.99% | |
| Price / MA100: | -5.98% | |
| Price / MAexp7: | +0.94% | |
| Price / MAexp20: | +0.94% | |
| Price / MAexp50: | +0.75% | |
| Price / MAexp100: | +0.66% |
News
Don't forget to follow the news on AGFA-GEVAERT. At the time of publication of this analysis, the latest news was as follows:
- AGFA Healthcare to Demonstrate AI's New Role in Medical Imaging at Tampa General Hospital's First-Ever Innovation Week
- AGFA HealthCare and Corista Announce North America Launch of its Integrated Solution for Digital Transformation in Pathology
- AGFA HealthCare: Leading the Way in Imaging Innovation at SIIM 2024
- AGFA HealthCare Secures Major New Deal With Alliance Medical for a Comprehensive Cloud-Based Enterprise Imaging Solution Across the UK
- Which Vendors Are Perceived as Ready for the Cloud: AGFA HealthCare’s Enterprise Imaging Customers Show Confidence in AGFA HealthCare’s Cloud Strategy, Reports KLAS Research
About author
Online


Add a comment
Comments
0 comments on the analysis AGFA-GEVAERT - 1H