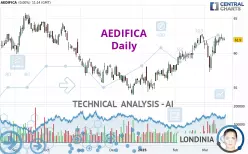
AEDIFICA - Daily - Technical analysis published on 03/20/2025 (GMT)
- 77
- 0
- Timeframe : Daily
- - Analysis generated on
- Status : IN PROGRESS...

Summary of the analysis

Additional analysis
Quotes
The AEDIFICA rating is 61.90 EUR. The price has increased by +0.00% since the last closing and was traded between 61.75 EUR and 62.25 EUR over the period. The price is currently at +0.24% from its lowest and -0.56% from its highest.So that you have an overall view of the price change, here is a table showing the variations over several periods:
Near a new HIGH record (1st january)
Type : Bullish
Timeframe : Weekly
Near a new HIGH record (1 month)
Type : Bullish
Timeframe : Weekly
Technical
Technical analysis of AEDIFICA in Daily shows a strongly overall bullish trend. The signals given by the moving averages are 92.86% bullish. This strong bullish trend is confirmed by the strong signals currently being given by short-term moving averages. The Central Indicators market scanner currently does not detect any result that concerns moving averages.
In fact, according to the parameters integrated into the Central Analyzer system, 10 technical indicators out of 18 analysed are currently bullish. But beware of excesses. The Central Indicators scanner currently detects this:
MACD indicator: bearish divergence
Type : Bearish
Timeframe : Daily
Williams %R indicator is overbought : over -20
Type : Neutral
Timeframe : Daily
An analysis of the price chart with the Central Patterns scanner (detector of chart patterns and resistances and supports) shows a result that can have an impact on the price change:
Near resistance of triangle
Type : Bearish
Timeframe : Daily
The Central Candlesticks scanner currently notes the presence of this pattern in Japanese candlesticks that could mark the end of the short-term trend currently underway:
Doji
Type : Neutral
Timeframe : Daily
| S3 | S2 | S1 | Price | R1 | R2 | R3 | |
|---|---|---|---|---|---|---|---|
| ProTrendLines | 56.00 | 57.92 | 61.40 | 61.90 | 62.66 | 65.44 | 79.45 |
| Change (%) | -9.53% | -6.43% | -0.81% | - | +1.23% | +5.72% | +28.35% |
| Change | -5.90 | -3.98 | -0.50 | - | +0.76 | +3.54 | +17.55 |
| Level | Minor | Intermediate | Intermediate | - | Major | Major | Intermediate |
To determine price objectives, it is also possible to use the pivot points. Here is the price position in relation to pivot points:
| Pivot points | S3 | S2 | S1 | PP | R1 | R2 | R3 |
|---|---|---|---|---|---|---|---|
| Standard | 61.03 | 61.37 | 61.63 | 61.97 | 62.23 | 62.57 | 62.83 |
| Camarilla | 61.74 | 61.79 | 61.85 | 61.90 | 61.96 | 62.01 | 62.07 |
| Woodie | 61.00 | 61.35 | 61.60 | 61.95 | 62.20 | 62.55 | 62.80 |
| Fibonacci | 61.37 | 61.60 | 61.74 | 61.97 | 62.20 | 62.34 | 62.57 |
| Pivot points | S3 | S2 | S1 | PP | R1 | R2 | R3 |
|---|---|---|---|---|---|---|---|
| Standard | 57.32 | 58.43 | 60.17 | 61.28 | 63.02 | 64.13 | 65.87 |
| Camarilla | 61.12 | 61.38 | 61.64 | 61.90 | 62.16 | 62.42 | 62.68 |
| Woodie | 57.63 | 58.59 | 60.48 | 61.44 | 63.33 | 64.29 | 66.18 |
| Fibonacci | 58.43 | 59.52 | 60.20 | 61.28 | 62.37 | 63.05 | 64.13 |
| Pivot points | S3 | S2 | S1 | PP | R1 | R2 | R3 |
|---|---|---|---|---|---|---|---|
| Standard | 53.12 | 55.18 | 58.62 | 60.68 | 64.12 | 66.18 | 69.62 |
| Camarilla | 60.54 | 61.04 | 61.55 | 62.05 | 62.55 | 63.06 | 63.56 |
| Woodie | 53.80 | 55.53 | 59.30 | 61.03 | 64.80 | 66.53 | 70.30 |
| Fibonacci | 55.18 | 57.28 | 58.58 | 60.68 | 62.78 | 64.08 | 66.18 |
Numerical data
The following is the status of technical indicators and moving averages registered at the time this technical analysis was created:
| RSI (14): | 57.37 | |
| MACD (12,26,9): | 0.6600 | |
| Directional Movement: | 4.54 | |
| AROON (14): | 57.14 | |
| DEMA (21): | 61.96 | |
| Parabolic SAR (0,02-0,02-0,2): | 58.65 | |
| Elder Ray (13): | 0.61 | |
| Super Trend (3,10): | 58.44 | |
| Zig ZAG (10): | 61.95 | |
| VORTEX (21): | 1.0300 | |
| Stochastique (14,3,5): | 85.29 | |
| TEMA (21): | 61.95 | |
| Williams %R (14): | -15.32 | |
| Chande Momentum Oscillator (20): | 0.35 | |
| Repulse (5,40,3): | 0.0900 | |
| ROCnROLL: | 1 | |
| TRIX (15,9): | 0.1500 | |
| Courbe Coppock: | 0.62 |
| MA7: | 61.95 | |
| MA20: | 61.27 | |
| MA50: | 59.37 | |
| MA100: | 58.16 | |
| MAexp7: | 61.72 | |
| MAexp20: | 61.06 | |
| MAexp50: | 59.88 | |
| MAexp100: | 59.29 | |
| Price / MA7: | -0.08% | |
| Price / MA20: | +1.03% | |
| Price / MA50: | +4.26% | |
| Price / MA100: | +6.43% | |
| Price / MAexp7: | +0.29% | |
| Price / MAexp20: | +1.38% | |
| Price / MAexp50: | +3.37% | |
| Price / MAexp100: | +4.40% |
News
The latest news and videos published on AEDIFICA at the time of the analysis were as follows:
- Aedifica NV/SA: 2024 annual results
- Aedifica NV/SA: Repurchase of own shares
- Aedifica NV/SA: Interim financial report – Q3 2024
- Aedifica NV/SA: Publication relating to a transparency notification
- Aedifica NV/SA: 2024 half year financial report
About author
Online


Add a comment
Comments
0 comments on the analysis AEDIFICA - Daily