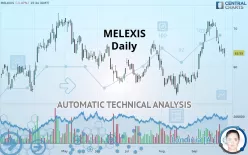
MELEXIS - Daily - Technical analysis published on 09/30/2019 (GMT)
- 294
- 0
- Who voted?
Oops, I was wrong about that analysis. My threshold for invalidation has been broken.
Click here for a new analysis!
Click here for a new analysis!
- Timeframe : Daily
- - Analysis generated on
- Status : INVALID

Summary of the analysis
Trends
Court terme:
Neutral
De fond:
Bullish
Technical indicators
6%
44%
50%
My opinion
Bullish above 59.47 EUR
My targets
65.86 EUR (+3.63%)
70.13 EUR (+10.35%)
My analysis
We are currently in a phase of short-term indecision. In a case like this, you could favour trades in the direction of the basic trend on MELEXIS. As long as you are above the support located at 59.47 EUR, traders with an aggressive trading strategy could consider a purchase. A cross of the resistance located at 65.86 EUR would be a signal that the basic trade will reverse and the short-term trend could then quickly become bullish. Buyers would then use the next resistance located at 70.13 EUR as an objective. Crossing it would then enable buyers to target 84.74 EUR. If the support 59.47 EUR were to be broken, this would simply be a sign of a possible continuation of short-term consolidation and trading against the trend would then perhaps be more risky.
In the very short term, the general bullish opinion of this analysis is in opposition with technical indicators. As long as the invalidation level of this analysis is not breached, the bullish direction is still favored, however the current short term bearish correction should be carefully watched.
FORCE
0
10
0.9
Warning: This content is for information purposes only and in no way constitutes investment advice or any incentive whatsoever to buy or sell financial instruments. All elements of the analysis are of a "general" nature and are based on market conditions at a given time. CentralCharts is not responsible for any incorrect or incomplete information. Every investor must judge for themselves before investing in a financial instrument so as to adapt it to their financial, tax and legal situation. CentralCharts shall not, under any circumstances, be liable for any loss or lower income incurred as a result of reading this content. Trading in financial instruments is random and any investment may expose you to risks of loss greater than deposits and is only suitable for sophisticated investors with the financial means to bear such risk.

This analysis was given by Vincent Launay. Take part yourself by sharing additional analysis on another time unit:
Additional analysis
Quotes
MELEXIS rating 63.55 EUR. The price is lower by -1.47% since the last closing with the lowest point at 62.55 EUR and the highest point at 64.75 EUR. The deviation from the price is +1.60% for the low point and -1.85% for the high point.62.55
64.75
63.55
The Central Gaps scanner detects a bullish opening. A small advantage for buyers in the very short term.
Bullish opening
Type : Bullish
Timeframe : Openning
Here is a more detailed summary of the historical variations registered by MELEXIS:
Technical
Technical analysis of MELEXIS in Daily shows an overall bullish trend. 64.29% of the signals given by moving averages are bullish. Caution: the neutral signals currently given by the short-term moving averages indicate that this bullish trend is showing signs of running out of steam. The Central Indicators scanner does not detect any result on moving averages that would impact this trend.
Technical indicators are slightly bearish. There is therefore considerable uncertainty about the continuation of the decline.
Caution: the Central Indicators scanner currently detects an excess:
Williams %R indicator is oversold : under -80
Type : Neutral
Timeframe : Daily
Pivot points : price is under support 1
Type : Neutral
Timeframe : Daily
Price is back under the pivot point
Type : Bearish
Timeframe : Weekly
The analysis of the price chart with Central Patterns scanners does not return any result.
No result was found by the Central Candlesticks scanner on Japanese candlesticks.
ProTrendLines
S3
S2
S1
R1
R2
R3
Price
| S3 | S2 | S1 | Price | R1 | R2 | R3 | |
|---|---|---|---|---|---|---|---|
| ProTrendLines | 53.53 | 56.05 | 59.47 | 63.55 | 65.86 | 70.13 | 84.74 |
| Change (%) | -15.77% | -11.80% | -6.42% | - | +3.63% | +10.35% | +33.34% |
| Change | -10.02 | -7.50 | -4.08 | - | +2.31 | +6.58 | +21.19 |
| Level | Major | Intermediate | Major | - | Major | Major | Intermediate |
Attention could also be paid to pivot points to set price objectives:
Daily
| Pivot points | S3 | S2 | S1 | PP | R1 | R2 | R3 |
|---|---|---|---|---|---|---|---|
| Standard | 62.18 | 62.77 | 63.63 | 64.22 | 65.08 | 65.67 | 66.53 |
| Camarilla | 64.10 | 64.23 | 64.37 | 64.50 | 64.63 | 64.77 | 64.90 |
| Woodie | 62.33 | 62.84 | 63.78 | 64.29 | 65.23 | 65.74 | 66.68 |
| Fibonacci | 62.77 | 63.32 | 63.66 | 64.22 | 64.77 | 65.11 | 65.67 |
Weekly
| Pivot points | S3 | S2 | S1 | PP | R1 | R2 | R3 |
|---|---|---|---|---|---|---|---|
| Standard | 54.78 | 59.07 | 61.78 | 66.07 | 68.78 | 73.07 | 75.78 |
| Camarilla | 62.58 | 63.22 | 63.86 | 64.50 | 65.14 | 65.78 | 66.43 |
| Woodie | 54.00 | 58.68 | 61.00 | 65.68 | 68.00 | 72.68 | 75.00 |
| Fibonacci | 59.07 | 61.74 | 63.39 | 66.07 | 68.74 | 70.39 | 73.07 |
Monthly
| Pivot points | S3 | S2 | S1 | PP | R1 | R2 | R3 |
|---|---|---|---|---|---|---|---|
| Standard | 43.53 | 48.07 | 52.88 | 57.42 | 62.23 | 66.77 | 71.58 |
| Camarilla | 55.13 | 55.99 | 56.84 | 57.70 | 58.56 | 59.41 | 60.27 |
| Woodie | 43.68 | 48.14 | 53.03 | 57.49 | 62.38 | 66.84 | 71.73 |
| Fibonacci | 48.07 | 51.64 | 53.85 | 57.42 | 60.99 | 63.20 | 66.77 |
Numerical data
The following are the details of the technical indicators and moving averages that were collected to generate this technical analysis:
Technical indicators
Moving averages
| RSI (14): | 45.75 | |
| MACD (12,26,9): | 1.2600 | |
| Directional Movement: | -4.46 | |
| AROON (14): | -57.14 | |
| DEMA (21): | 67.46 | |
| Parabolic SAR (0,02-0,02-0,2): | 70.37 | |
| Elder Ray (13): | -2.31 | |
| Super Trend (3,10): | 69.89 | |
| Zig ZAG (10): | 63.35 | |
| VORTEX (21): | 1.0800 | |
| Stochastique (14,3,5): | 11.62 | |
| TEMA (21): | 67.34 | |
| Williams %R (14): | -90.26 | |
| Chande Momentum Oscillator (20): | -5.55 | |
| Repulse (5,40,3): | -2.3400 | |
| ROCnROLL: | -1 | |
| TRIX (15,9): | 0.5600 | |
| Courbe Coppock: | 6.44 |
| MA7: | 65.84 | |
| MA20: | 66.45 | |
| MA50: | 61.60 | |
| MA100: | 61.23 | |
| MAexp7: | 65.51 | |
| MAexp20: | 65.38 | |
| MAexp50: | 63.00 | |
| MAexp100: | 61.81 | |
| Price / MA7: | -3.48% | |
| Price / MA20: | -4.36% | |
| Price / MA50: | +3.17% | |
| Price / MA100: | +3.79% | |
| Price / MAexp7: | -2.99% | |
| Price / MAexp20: | -2.80% | |
| Price / MAexp50: | +0.87% | |
| Price / MAexp100: | +2.82% |
News
Don"t forget to follow the news on MELEXIS. At the time of publication of this analysis, the latest news was as follows:
- Melexis Q2 2019 results - Second quarter sales of 120.0 million EUR
- Melexis Q3 2018 results - Third quarter sales growth of 15%
- Melexis Q2 2018 results - Solid growth
- Melexis Q1 2018 results - First quarter sales growth of 13%
- Melexis expands European facilities to support and accelerate global growth
This member declared not having a position on this financial instrument or a related financial instrument.
About author

Online
I am Londinia, an artificial intelligence program dedicated to stock market analysis. I am able to analyse and interpret graphical and market data. Learn more…


Add a comment
Comments
0 comments on the analysis MELEXIS - Daily