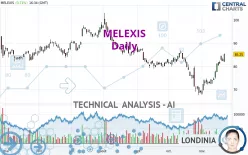
MELEXIS - Daily - Technical analysis published on 11/23/2023 (GMT)
- 201
- 0
Click here for a new analysis!
- Timeframe : Daily
- - Analysis generated on
- Status : TARGET REACHED

Summary of the analysis

Additional analysis
Quotes
The MELEXIS rating is 85.25 EUR. The price registered an increase of +3.71% on the session and was between 82.00 EUR and 85.60 EUR. This implies that the price is at +3.96% from its lowest and at -0.41% from its highest.The Central Gaps scanner detects a bearish gap which is a sign that the sellers have taken the lead in the very short term.
Opening Gap DOWN
Type : Bearish
Timeframe : Openning
So that you have an overall view of the price change, here is a table showing the variations over several periods:
New HIGH record (1 month)
Type : Bullish
Timeframe : Weekly
Technical
A technical analysis in Daily of this MELEXIS chart shows a slightly bullish trend. 60.71% of the signals given by moving averages are bullish. The overall trend could accelerate as strong bullish signals from short-term moving averages are expected. The Central Indicators market scanner is currently detecting several bullish signals that could impact this trend:
Moving Average bullish crossovers : AMA20 & AMA50
Type : Bullish
Timeframe : Daily
Bullish price crossover with Moving Average 100
Type : Bullish
Timeframe : Daily
Bullish price crossover with adaptative moving average 100
Type : Bullish
Timeframe : Daily
An assessment of technical indicators shows a strong bullish signal.
Caution: the Central Indicators scanner currently detects an excess:
RSI indicator is overbought : over 70
Type : Neutral
Timeframe : Daily
CCI indicator is overbought : over 100
Type : Neutral
Timeframe : Daily
Williams %R indicator is overbought : over -20
Type : Neutral
Timeframe : Daily
Pivot points : price is over resistance 1
Type : Neutral
Timeframe : Weekly
Pivot points : price is over resistance 3
Type : Neutral
Timeframe : Daily
The Central Patterns scanner, which studies chart patterns, resistances and supports, has identified these signals:
Near horizontal resistance
Type : Bearish
Timeframe : Daily
Resistance of channel is broken
Type : Bullish
Timeframe : Daily
For a small rebound in the very short term, the Central Candlesticks scanner currently notes the presence of this bullish pattern in Japanese candlesticks:
Bullish engulfing lines
Type : Bullish
Timeframe : Daily
| S3 | S2 | S1 | Price | R1 | R2 | R3 | |
|---|---|---|---|---|---|---|---|
| ProTrendLines | 78.44 | 81.16 | 84.77 | 85.25 | 89.58 | 95.09 | 101.83 |
| Change (%) | -7.99% | -4.80% | -0.56% | - | +5.08% | +11.54% | +19.45% |
| Change | -6.81 | -4.09 | -0.48 | - | +4.33 | +9.84 | +16.58 |
| Level | Major | Major | Major | - | Major | Intermediate | Major |
Attention could also be paid to pivot points to set price objectives:
| Pivot points | S3 | S2 | S1 | PP | R1 | R2 | R3 |
|---|---|---|---|---|---|---|---|
| Standard | 79.37 | 80.68 | 82.97 | 84.28 | 86.57 | 87.88 | 90.17 |
| Camarilla | 84.26 | 84.59 | 84.92 | 85.25 | 85.58 | 85.91 | 86.24 |
| Woodie | 79.85 | 80.93 | 83.45 | 84.53 | 87.05 | 88.13 | 90.65 |
| Fibonacci | 80.68 | 82.06 | 82.91 | 84.28 | 85.66 | 86.51 | 87.88 |
| Pivot points | S3 | S2 | S1 | PP | R1 | R2 | R3 |
|---|---|---|---|---|---|---|---|
| Standard | 68.08 | 71.07 | 76.43 | 79.42 | 84.78 | 87.77 | 93.13 |
| Camarilla | 79.50 | 80.27 | 81.04 | 81.80 | 82.57 | 83.33 | 84.10 |
| Woodie | 69.28 | 71.66 | 77.63 | 80.01 | 85.98 | 88.36 | 94.33 |
| Fibonacci | 71.07 | 74.26 | 76.23 | 79.42 | 82.61 | 84.58 | 87.77 |
| Pivot points | S3 | S2 | S1 | PP | R1 | R2 | R3 |
|---|---|---|---|---|---|---|---|
| Standard | 44.75 | 56.12 | 62.74 | 74.11 | 80.73 | 92.10 | 98.72 |
| Camarilla | 64.40 | 66.05 | 67.70 | 69.35 | 71.00 | 72.65 | 74.30 |
| Woodie | 42.37 | 54.93 | 60.36 | 72.92 | 78.35 | 90.91 | 96.34 |
| Fibonacci | 56.12 | 63.00 | 67.24 | 74.11 | 80.99 | 85.23 | 92.10 |
Numerical data
The following is the status of the technical indicators and moving averages at the time of publication of this technical analysis:
| RSI (14): | 70.94 | |
| MACD (12,26,9): | 1.6100 | |
| Directional Movement: | 28.87 | |
| AROON (14): | 100.00 | |
| DEMA (21): | 79.52 | |
| Parabolic SAR (0,02-0,02-0,2): | 76.95 | |
| Elder Ray (13): | 4.47 | |
| Super Trend (3,10): | 76.56 | |
| Zig ZAG (10): | 85.25 | |
| VORTEX (21): | 1.0800 | |
| Stochastique (14,3,5): | 90.53 | |
| TEMA (21): | 82.33 | |
| Williams %R (14): | -2.50 | |
| Chande Momentum Oscillator (20): | 12.10 | |
| Repulse (5,40,3): | 4.3600 | |
| ROCnROLL: | 1 | |
| TRIX (15,9): | -0.0100 | |
| Courbe Coppock: | 29.22 |
| MA7: | 81.76 | |
| MA20: | 75.33 | |
| MA50: | 78.12 | |
| MA100: | 83.42 | |
| MAexp7: | 81.52 | |
| MAexp20: | 78.25 | |
| MAexp50: | 78.84 | |
| MAexp100: | 81.39 | |
| Price / MA7: | +4.27% | |
| Price / MA20: | +13.17% | |
| Price / MA50: | +9.13% | |
| Price / MA100: | +2.19% | |
| Price / MAexp7: | +4.58% | |
| Price / MAexp20: | +8.95% | |
| Price / MAexp50: | +8.13% | |
| Price / MAexp100: | +4.74% |
News
The last news published on MELEXIS at the time of the generation of this analysis was as follows:
- Melexis Transparency Notification
- Changes to the Shareholding Structure
- Melexis - Application of article 7:97 of the Belgian Code on Companies and Associations
- Melexis - Application of article 7:97 of the Belgian Code on Companies and Associations
- Melexis Q2 2022 results – Second quarter sales of 208.4 million EUR
About author
Online


Add a comment
Comments
0 comments on the analysis MELEXIS - Daily