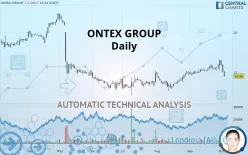
ONTEX GROUP - Daily - Technical analysis published on 10/03/2019 (GMT)
- 324
- 0
- Who voted?
Click here for a new analysis!
- Timeframe : Daily
- - Analysis generated on
- Status : INVALID

Summary of the analysis

Additional analysis
Quotes
ONTEX GROUP rating 14.56 EUR. The price registered a decrease of -3.26% on the session with the lowest point at 14.43 EUR and the highest point at 15.15 EUR. The deviation from the price is +0.90% for the low point and -3.89% for the high point.The Central Gaps scanner detects a bullish opening. A small advantage for buyers in the very short term.
Bullish opening
Type : Bullish
Timeframe : Openning
A study of price movements over other periods shows the following variations:
Technical
Technical analysis of this Daily chart of ONTEX GROUP indicates that the overall trend is bearish. 64.29% of the signals given by moving averages are bearish. The overall trend is reinforced by the strong bearish signals from short-term moving averages. The Central Indicators scanner detects bearish signals on moving averages that could impact this trend:
Bearish trend reversal : Moving Average 100
Type : Bearish
Timeframe : Daily
Bearish trend reversal : adaptative moving average 20
Type : Bearish
Timeframe : Daily
Bearish trend reversal : adaptative moving average 100
Type : Bearish
Timeframe : Daily
Bearish price crossover with Moving Average 20
Type : Bearish
Timeframe : Daily
Bearish price crossover with adaptative moving average 20
Type : Bearish
Timeframe : Daily
The probability of a further decline is moderate given the direction of the technical indicators.
But beware of excesses. The Central Indicators scanner currently detects this:
Williams %R indicator is oversold : under -80
Type : Neutral
Timeframe : Daily
Pivot points : price is under support 1
Type : Neutral
Timeframe : Daily
Pivot points : price is under support 3
Type : Neutral
Timeframe : Weekly
RSI indicator is back under 50
Type : Bearish
Timeframe : Daily
MACD crosses DOWN its Moving Average
Type : Bearish
Timeframe : Daily
Parabolic SAR indicator bearish reversal
Type : Bearish
Timeframe : Daily
Momentum indicator is back under 0
Type : Bearish
Timeframe : Daily
Williams %R indicator is back under -50
Type : Bearish
Timeframe : Daily
The Central Patterns scanner, which studies chart patterns, resistances and supports, has identified this signal:
Horizontal support is broken
Type : Bearish
Timeframe : Daily
The Central Candlesticks scanner, specialised in Japanese candlesticks, did not identify any signals.
| S2 | S1 | Price | R1 | R2 | R3 | |
|---|---|---|---|---|---|---|
| ProTrendLines | 12.98 | 14.16 | 14.56 | 14.92 | 16.21 | 17.04 |
| Change (%) | -10.85% | -2.75% | - | +2.47% | +11.33% | +17.03% |
| Change | -1.58 | -0.40 | - | +0.36 | +1.65 | +2.48 |
| Level | Major | Minor | - | Major | Minor | Minor |
Pivot points can also be used to set your price objectives. Here is the price situation in relation to pivot points:
| Pivot points | S3 | S2 | S1 | PP | R1 | R2 | R3 |
|---|---|---|---|---|---|---|---|
| Standard | 13.83 | 14.42 | 14.74 | 15.33 | 15.65 | 16.24 | 16.56 |
| Camarilla | 14.80 | 14.88 | 14.97 | 15.05 | 15.13 | 15.22 | 15.30 |
| Woodie | 13.69 | 14.35 | 14.60 | 15.26 | 15.51 | 16.17 | 16.42 |
| Fibonacci | 14.42 | 14.77 | 14.99 | 15.33 | 15.68 | 15.90 | 16.24 |
| Pivot points | S3 | S2 | S1 | PP | R1 | R2 | R3 |
|---|---|---|---|---|---|---|---|
| Standard | 14.71 | 14.96 | 15.46 | 15.71 | 16.21 | 16.46 | 16.96 |
| Camarilla | 15.74 | 15.81 | 15.88 | 15.95 | 16.02 | 16.09 | 16.16 |
| Woodie | 14.83 | 15.02 | 15.58 | 15.77 | 16.33 | 16.52 | 17.08 |
| Fibonacci | 14.96 | 15.25 | 15.43 | 15.71 | 16.00 | 16.18 | 16.46 |
| Pivot points | S3 | S2 | S1 | PP | R1 | R2 | R3 |
|---|---|---|---|---|---|---|---|
| Standard | 13.35 | 13.98 | 15.25 | 15.88 | 17.15 | 17.78 | 19.05 |
| Camarilla | 15.99 | 16.16 | 16.34 | 16.51 | 16.68 | 16.86 | 17.03 |
| Woodie | 13.66 | 14.14 | 15.56 | 16.04 | 17.46 | 17.94 | 19.36 |
| Fibonacci | 13.98 | 14.71 | 15.16 | 15.88 | 16.61 | 17.06 | 17.78 |
Numerical data
The following is the status of technical indicators and moving averages registered at the time this technical analysis was created:
| RSI (14): | 41.06 | |
| MACD (12,26,9): | 0.2200 | |
| Directional Movement: | -2.89 | |
| AROON (14): | -21.43 | |
| DEMA (21): | 15.70 | |
| Parabolic SAR (0,02-0,02-0,2): | 16.50 | |
| Elder Ray (13): | -0.66 | |
| Super Trend (3,10): | 16.47 | |
| Zig ZAG (10): | 14.57 | |
| VORTEX (21): | 0.9600 | |
| Stochastique (14,3,5): | 23.52 | |
| TEMA (21): | 15.64 | |
| Williams %R (14): | -92.82 | |
| Chande Momentum Oscillator (20): | -0.69 | |
| Repulse (5,40,3): | -7.7500 | |
| ROCnROLL: | 2 | |
| TRIX (15,9): | 0.3500 | |
| Courbe Coppock: | 4.32 |
| MA7: | 15.62 | |
| MA20: | 15.45 | |
| MA50: | 14.64 | |
| MA100: | 14.27 | |
| MAexp7: | 15.42 | |
| MAexp20: | 15.36 | |
| MAexp50: | 14.94 | |
| MAexp100: | 15.06 | |
| Price / MA7: | -6.79% | |
| Price / MA20: | -5.76% | |
| Price / MA50: | -0.55% | |
| Price / MA100: | +2.03% | |
| Price / MAexp7: | -5.58% | |
| Price / MAexp20: | -5.21% | |
| Price / MAexp50: | -2.54% | |
| Price / MAexp100: | -3.32% |
News
Don"t forget to follow the news on ONTEX GROUP. At the time of publication of this analysis, the latest news was as follows:
- Ontex: Transparency Declaration Notification
- Suzano Eucafluff joins Ontex's 40 year event
-
 Ontex Group
-
Ontex Group
About author

Online


Add a comment
Comments
0 comments on the analysis ONTEX GROUP - Daily