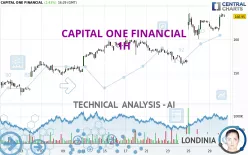
CAPITAL ONE FINANCIAL - 1H - Technical analysis published on 10/30/2024 (GMT)
- 129
- 0
Click here for a new analysis!
- Timeframe : 1H
- - Analysis generated on
- Status : INVALID

Summary of the analysis

Additional analysis
Quotes
The CAPITAL ONE FINANCIAL rating is 166.95 USD. The price registered an increase of +2.43% on the session and was between 163.05 USD and 167.88 USD. This implies that the price is at +2.39% from its lowest and at -0.55% from its highest.A study of price movements over other periods shows the following variations:
Near a new HIGH record (5 years)
Type : Bullish
Timeframe : Weekly
Near a new HIGH record (1 year)
Type : Bullish
Timeframe : Weekly
Near a new HIGH record (1st january)
Type : Bullish
Timeframe : Weekly
Near a new HIGH record (1 month)
Type : Bullish
Timeframe : Weekly
Technical
A technical analysis in 1H of this CAPITAL ONE FINANCIAL chart shows a strongly bullish trend. The signals given by the moving averages are 92.86% bullish. This strong bullish trend is confirmed by the strong signals currently being given by short-term moving averages. There is no crossing of moving average by the price or crossing of moving averages between themselves.
The probability of a further increase is high given the direction of the technical indicators.
The Central Indicators scanner found this result concerning these indicators:
Pivot points : price is over resistance 2
Type : Neutral
Timeframe : 1 hour
The Central Patterns scanner, which studies chart patterns, resistances and supports, has identified these signals:
Near horizontal resistance
Type : Bearish
Timeframe : 1 hour
Near resistance of channel
Type : Bearish
Timeframe : 1 hour
There is also a Japanese candlestick pattern detected by Central Candlesticks that could mark the end of the current short-term trend:
Doji
Type : Neutral
Timeframe : 1 hour
| S3 | S2 | S1 | Price | R1 | |
|---|---|---|---|---|---|
| ProTrendLines | 153.05 | 162.60 | 165.91 | 166.95 | 168.46 |
| Change (%) | -8.33% | -2.61% | -0.62% | - | +0.90% |
| Change | -13.90 | -4.35 | -1.04 | - | +1.51 |
| Level | Intermediate | Intermediate | Intermediate | - | Major |
Attention could also be paid to pivot points to set price objectives:
| Pivot points | S3 | S2 | S1 | PP | R1 | R2 | R3 |
|---|---|---|---|---|---|---|---|
| Standard | 158.98 | 160.73 | 161.86 | 163.61 | 164.74 | 166.49 | 167.62 |
| Camarilla | 162.20 | 162.46 | 162.73 | 162.99 | 163.25 | 163.52 | 163.78 |
| Woodie | 158.67 | 160.58 | 161.55 | 163.46 | 164.43 | 166.34 | 167.31 |
| Fibonacci | 160.73 | 161.83 | 162.51 | 163.61 | 164.71 | 165.39 | 166.49 |
| Pivot points | S3 | S2 | S1 | PP | R1 | R2 | R3 |
|---|---|---|---|---|---|---|---|
| Standard | 137.31 | 144.76 | 153.02 | 160.47 | 168.73 | 176.18 | 184.44 |
| Camarilla | 156.95 | 158.39 | 159.83 | 161.27 | 162.71 | 164.15 | 165.59 |
| Woodie | 137.71 | 144.96 | 153.42 | 160.67 | 169.13 | 176.38 | 184.84 |
| Fibonacci | 144.76 | 150.77 | 154.47 | 160.47 | 166.48 | 170.18 | 176.18 |
| Pivot points | S3 | S2 | S1 | PP | R1 | R2 | R3 |
|---|---|---|---|---|---|---|---|
| Standard | 113.50 | 122.52 | 136.13 | 145.15 | 158.76 | 167.78 | 181.39 |
| Camarilla | 143.51 | 145.58 | 147.66 | 149.73 | 151.80 | 153.88 | 155.95 |
| Woodie | 115.79 | 123.67 | 138.42 | 146.30 | 161.05 | 168.93 | 183.68 |
| Fibonacci | 122.52 | 131.17 | 136.51 | 145.15 | 153.80 | 159.14 | 167.78 |
Numerical data
The following are the details of the technical indicators and moving averages that were collected to generate this technical analysis:
| RSI (14): | 67.89 | |
| MACD (12,26,9): | 1.7200 | |
| Directional Movement: | 20.66 | |
| AROON (14): | 14.29 | |
| DEMA (21): | 166.23 | |
| Parabolic SAR (0,02-0,02-0,2): | 161.66 | |
| Elder Ray (13): | 2.38 | |
| Super Trend (3,10): | 162.67 | |
| Zig ZAG (10): | 167.47 | |
| VORTEX (21): | 1.0900 | |
| Stochastique (14,3,5): | 89.31 | |
| TEMA (21): | 166.63 | |
| Williams %R (14): | -7.77 | |
| Chande Momentum Oscillator (20): | 1.94 | |
| Repulse (5,40,3): | 1.3700 | |
| ROCnROLL: | 1 | |
| TRIX (15,9): | 0.1600 | |
| Courbe Coppock: | 1.20 |
| MA7: | 160.09 | |
| MA20: | 156.33 | |
| MA50: | 149.11 | |
| MA100: | 144.20 | |
| MAexp7: | 165.67 | |
| MAexp20: | 163.91 | |
| MAexp50: | 161.15 | |
| MAexp100: | 158.29 | |
| Price / MA7: | +4.29% | |
| Price / MA20: | +6.79% | |
| Price / MA50: | +11.96% | |
| Price / MA100: | +15.78% | |
| Price / MAexp7: | +0.77% | |
| Price / MAexp20: | +1.85% | |
| Price / MAexp50: | +3.60% | |
| Price / MAexp100: | +5.47% |
News
The latest news and videos published on CAPITAL ONE FINANCIAL at the time of the analysis were as follows:
- Investor Network: Capital One Financial Corporation to Host Earnings Call
- Capital One Announces Quarterly Dividend
- Capital One Reports Third Quarter 2016 Net Income of $1.0 billion, or $1.90 per share
- Capital One to be exclusive long-term card issuing partner with Leading Outdoor Retailer Cabela's
- Capital One Financial Corporation to Webcast Conference Call on Third Quarter 2016 Earnings
About author
Online


Add a comment
Comments
0 comments on the analysis CAPITAL ONE FINANCIAL - 1H