| Open: | 1.0789 |
| Change: | -0.0003 |
| Volume: | 106,958 |
| Low: | 1.0767 |
| High: | 1.0803 |
| High / Low range: | 0.0036 |
| Type: | Stocks |
| Ticker: | SOF |
| ISIN: | BE0003717312 |
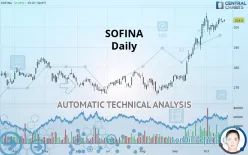
SOFINA - Daily - Technical analysis published on 10/17/2019 (GMT)
- 317
- 0
- 10/17/2019 - 15:33
- Who voted?
Click here for a new analysis!
- Timeframe : Daily
- - Analysis generated on 10/17/2019 - 15:25
- Status : INVALID

Summary of the analysis

Additional analysis
Quotes
SOFINA rating 203.5 EUR. The price registered an increase of +0.49% on the session with the lowest point at 202.5 EUR and the highest point at 204.0 EUR. The deviation from the price is +0.49% for the low point and -0.25% for the high point.A bullish opening was detected by the Central Gaps scanner. Buyers are trying to impose a bullish momentum in the very short term.
Bullish opening
Type : Bullish
Timeframe : Openning
A study of price movements over other periods shows the following variations:
Near a new HIGH record (5 years)
Type : Bullish
Timeframe : Weekly
Near a new HIGH record (1st january)
Type : Bullish
Timeframe : Weekly
Near a new HIGH record (1 month)
Type : Bullish
Timeframe : Weekly
Technical
Technical analysis of this Daily chart of SOFINA indicates that the overall trend is strongly bullish. The signals given by the moving averages are 92.86% bullish. This strong bullish trend is confirmed by the strong signals currently being given by short-term moving averages. There is no crossing of moving average by the price or crossing of moving averages between themselves.
In fact, only 9 technical indicators out of 18 studied are currently positioned bullish. But beware of excesses. The Central Indicators scanner currently detects this:
Williams %R indicator is overbought : over -20
Type : Neutral
Timeframe : Daily
Pivot points : price is over resistance 1
Type : Neutral
Timeframe : Daily
Price is back over the pivot point
Type : Bullish
Timeframe : Weekly
Momentum indicator is back under 0
Type : Bearish
Timeframe : Daily
The analysis of the price chart with Central Patterns scanners does not return any result.
The Central Candlesticks scanner which studies Japanese candlesticks did not detect anything.
| S3 | S2 | S1 | Price | R1 | |
|---|---|---|---|---|---|
| ProTrendLines | 177.1 | 184.0 | 198.8 | 203.5 | 205.5 |
| Change (%) | -12.97% | -9.58% | -2.31% | - | +0.98% |
| Change | -26.4 | -19.5 | -4.7 | - | +2.0 |
| Level | Intermediate | Major | Intermediate | - | Major |
Attention could also be paid to pivot points to set price objectives:
| Pivot points | S3 | S2 | S1 | PP | R1 | R2 | R3 |
|---|---|---|---|---|---|---|---|
| Standard | 201.0 | 201.5 | 202.0 | 202.5 | 203.0 | 203.5 | 204.0 |
| Camarilla | 202.2 | 202.3 | 202.4 | 202.5 | 202.6 | 202.7 | 202.8 |
| Woodie | 201.0 | 201.5 | 202.0 | 202.5 | 203.0 | 203.5 | 204.0 |
| Fibonacci | 201.5 | 201.9 | 202.1 | 202.5 | 202.9 | 203.1 | 203.5 |
| Pivot points | S3 | S2 | S1 | PP | R1 | R2 | R3 |
|---|---|---|---|---|---|---|---|
| Standard | 192.0 | 194.7 | 199.1 | 201.8 | 206.2 | 208.9 | 213.3 |
| Camarilla | 201.6 | 202.2 | 202.9 | 203.5 | 204.2 | 204.8 | 205.5 |
| Woodie | 192.9 | 195.1 | 200.0 | 202.2 | 207.1 | 209.3 | 214.2 |
| Fibonacci | 194.7 | 197.4 | 199.1 | 201.8 | 204.5 | 206.2 | 208.9 |
| Pivot points | S3 | S2 | S1 | PP | R1 | R2 | R3 |
|---|---|---|---|---|---|---|---|
| Standard | 151.7 | 162.3 | 183.2 | 193.8 | 214.7 | 225.3 | 246.2 |
| Camarilla | 195.3 | 198.2 | 201.1 | 204.0 | 206.9 | 209.8 | 212.7 |
| Woodie | 156.8 | 164.9 | 188.3 | 196.4 | 219.8 | 227.9 | 251.3 |
| Fibonacci | 162.3 | 174.4 | 181.8 | 193.8 | 205.9 | 213.3 | 225.3 |
Numerical data
The following is the status of technical indicators and moving averages registered at the time this technical analysis was created:
| RSI (14): | 68.60 | |
| MACD (12,26,9): | 5.0000 | |
| Directional Movement: | 15.7 | |
| AROON (14): | -14.3 | |
| DEMA (21): | 205.7 | |
| Parabolic SAR (0,02-0,02-0,2): | 200.7 | |
| Elder Ray (13): | 2.3 | |
| Super Trend (3,10): | 194.3 | |
| Zig ZAG (10): | 203.5 | |
| VORTEX (21): | 1.2000 | |
| Stochastique (14,3,5): | 64.80 | |
| TEMA (21): | 205.8 | |
| Williams %R (14): | -37.00 | |
| Chande Momentum Oscillator (20): | -2.5 | |
| Repulse (5,40,3): | 0.1000 | |
| ROCnROLL: | 1 | |
| TRIX (15,9): | 0.5000 | |
| Courbe Coppock: | 4.90 |
| MA7: | 202.6 | |
| MA20: | 200.2 | |
| MA50: | 185.0 | |
| MA100: | 178.5 | |
| MAexp7: | 202.4 | |
| MAexp20: | 198.5 | |
| MAexp50: | 189.5 | |
| MAexp100: | 182.8 | |
| Price / MA7: | +0.44% | |
| Price / MA20: | +1.65% | |
| Price / MA50: | +10.00% | |
| Price / MA100: | +14.01% | |
| Price / MAexp7: | +0.54% | |
| Price / MAexp20: | +2.52% | |
| Price / MAexp50: | +7.39% | |
| Price / MAexp100: | +11.32% |
 Sofina
About author

Online


Add a comment
Comments
0 comments on the analysis SOFINA - Daily