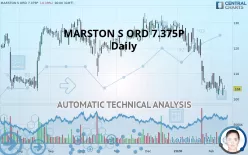
MARSTON S ORD 7.375P - Daily - Technical analysis published on 02/17/2020 (GMT)
- 416
- 0
- Who voted?
Click here for a new analysis!
- Timeframe : Daily
- - Analysis generated on
- Status : TARGET REACHED

Summary of the analysis

Additional analysis
Quotes
MARSTON S ORD 7.375P rating 104.00 GBX. The price registered an increase of -0.19% on the session and was between 104.00 GBX and 105.40 GBX. This implies that the price is at 0% from its lowest and at -1.33% from its highest.So that you have an overall view of the price change, here is a table showing the variations over several periods:
Near a new LOW record (1st january)
Type : Bearish
Timeframe : Weekly
Near a new LOW record (1 month)
Type : Bearish
Timeframe : Weekly
Technical
Technical analysis of MARSTON S ORD 7.375P in Daily shows a overall strongly bearish trend. The signals given by moving averages are 92.86% bearish. This strong bearish trend is confirmed by the strong signals currently being given by short-term moving averages. The Central Indicators market scanner currently does not detect any result that concerns moving averages.
An assessment of technical indicators does not currently provide any relevant information to suggest whether the signal given by the technical indicators is more bullish or bearish.
Caution: the Central Indicators scanner currently detects an excess:
Williams %R indicator is oversold : under -80
Type : Neutral
Timeframe : Daily
Williams %R indicator is overbought : over -20
Type : Neutral
Timeframe : Daily
Parabolic SAR indicator bullish reversal
Type : Bullish
Timeframe : Daily
Price is back under the pivot point
Type : Bearish
Timeframe : Daily
Price is back under the pivot point
Type : Bearish
Timeframe : Weekly
No signals are given by Central Patterns, a market scanner specialised in chart patterns, resistances and supports.
The Central Candlesticks scanner which studies Japanese candlesticks did not detect anything.
| S3 | S2 | S1 | Price | R1 | R2 | R3 | |
|---|---|---|---|---|---|---|---|
| ProTrendLines | 88.10 | 96.15 | 99.55 | 104.00 | 104.19 | 113.00 | 124.05 |
| Change (%) | -15.29% | -7.55% | -4.28% | - | +0.18% | +8.65% | +19.28% |
| Change | -15.90 | -7.85 | -4.45 | - | +0.19 | +9.00 | +20.05 |
| Level | Major | Minor | Intermediate | - | Major | Intermediate | Intermediate |
To determine price objectives, it is also possible to use the pivot points. Here is the price position in relation to pivot points:
| Pivot points | S3 | S2 | S1 | PP | R1 | R2 | R3 |
|---|---|---|---|---|---|---|---|
| Standard | 97.43 | 100.47 | 102.83 | 105.87 | 108.23 | 111.27 | 113.63 |
| Camarilla | 103.72 | 104.21 | 104.71 | 105.20 | 105.70 | 106.19 | 106.69 |
| Woodie | 97.10 | 100.30 | 102.50 | 105.70 | 107.90 | 111.10 | 113.30 |
| Fibonacci | 100.47 | 102.53 | 103.80 | 105.87 | 107.93 | 109.20 | 111.27 |
| Pivot points | S3 | S2 | S1 | PP | R1 | R2 | R3 |
|---|---|---|---|---|---|---|---|
| Standard | 90.63 | 96.77 | 100.73 | 106.87 | 110.83 | 116.97 | 120.93 |
| Camarilla | 101.92 | 102.85 | 103.77 | 104.70 | 105.63 | 106.55 | 107.48 |
| Woodie | 89.55 | 96.23 | 99.65 | 106.33 | 109.75 | 116.43 | 119.85 |
| Fibonacci | 96.77 | 100.63 | 103.01 | 106.87 | 110.73 | 113.11 | 116.97 |
| Pivot points | S3 | S2 | S1 | PP | R1 | R2 | R3 |
|---|---|---|---|---|---|---|---|
| Standard | 68.10 | 85.50 | 95.10 | 112.50 | 122.10 | 139.50 | 149.10 |
| Camarilla | 97.28 | 99.75 | 102.23 | 104.70 | 107.18 | 109.65 | 112.13 |
| Woodie | 64.20 | 83.55 | 91.20 | 110.55 | 118.20 | 137.55 | 145.20 |
| Fibonacci | 85.50 | 95.81 | 102.19 | 112.50 | 122.81 | 129.19 | 139.50 |
Numerical data
The following is the status of technical indicators and moving averages registered at the time this technical analysis was created:
| RSI (14): | 36.10 | |
| MACD (12,26,9): | -4.7000 | |
| Directional Movement: | -3.58 | |
| AROON (14): | -85.71 | |
| DEMA (21): | 103.16 | |
| Parabolic SAR (0,02-0,02-0,2): | 101.85 | |
| Elder Ray (13): | -0.05 | |
| Super Trend (3,10): | 116.26 | |
| Zig ZAG (10): | 106.50 | |
| VORTEX (21): | 0.8700 | |
| Stochastique (14,3,5): | 20.26 | |
| TEMA (21): | 101.58 | |
| Williams %R (14): | -64.64 | |
| Chande Momentum Oscillator (20): | -0.80 | |
| Repulse (5,40,3): | -5.9400 | |
| ROCnROLL: | 2 | |
| TRIX (15,9): | -0.6300 | |
| Courbe Coppock: | 19.83 |
| MA7: | 104.81 | |
| MA20: | 109.86 | |
| MA50: | 119.98 | |
| MA100: | 121.71 | |
| MAexp7: | 105.38 | |
| MAexp20: | 109.47 | |
| MAexp50: | 116.05 | |
| MAexp100: | 118.53 | |
| Price / MA7: | -0.77% | |
| Price / MA20: | -5.33% | |
| Price / MA50: | -13.32% | |
| Price / MA100: | -14.55% | |
| Price / MAexp7: | -1.31% | |
| Price / MAexp20: | -5.00% | |
| Price / MAexp50: | -10.38% | |
| Price / MAexp100: | -12.26% |
About author

Online


Add a comment
Comments
0 comments on the analysis MARSTON S ORD 7.375P - Daily