NASDAQ-100 VOLATILITY INDEX - 1H - Technical analysis published on 08/21/2023 (GMT)
- 259
- 0
Oops, I was wrong about that analysis. My threshold for invalidation has been broken.
Click here for a new analysis!
Click here for a new analysis!
- Timeframe : 1H
- - Analysis generated on
- Status : INVALID
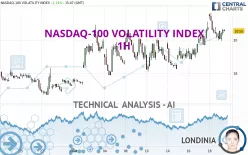

NASDAQ-100 VOLATILITY INDEX Chart
Summary of the analysis
Trends
Short term:
Strongly bullish
Underlying:
Strongly bullish
Technical indicators
39%
22%
39%
My opinion
Bullish above 20.50 USD
My targets
20.99 USD (+1.79%)
21.63 USD (+4.90%)
My analysis
NASDAQ-100 VOLATILITY INDEX is part of a very strong bullish trend. Traders may consider trading only long positions (at the time of purchase) as long as the price remains well above 20.50 USD. The next resistance located at 20.99 USD is the next bullish objective to be reached. A bullish break in this resistance would boost the bullish momentum. The bullish movement could then continue towards the next resistance located at 21.63 USD. After this resistance, buyers could then target 22.55 USD. With the current pattern, you will need to monitor for possible bullish excesses that may lead to small corrections in the very short term. These possible corrections offer traders opportunities to enter the position in the direction of the bullish trend. Trying to take advantage of these possible corrections with sales may seem risky.
In the very short term, the general bullish sentiment is not called into question, despite technical indicators being indecisive.
Force
0
10
6.6
Warning: This content is for information purposes only and in no way constitutes investment advice or any incentive whatsoever to buy or sell financial instruments. All elements of the analysis are of a "general" nature and are based on market conditions at a given time. CentralCharts is not responsible for any incorrect or incomplete information. Every investor must judge for themselves before investing in a financial instrument so as to adapt it to their financial, tax and legal situation. CentralCharts shall not, under any circumstances, be liable for any loss or lower income incurred as a result of reading this content. Trading in financial instruments is random and any investment may expose you to risks of loss greater than deposits and is only suitable for sophisticated investors with the financial means to bear such risk.
This analysis was given by Londinia.
Additional analysis
Quotes
NASDAQ-100 VOLATILITY INDEX rating 20.62 USD. The price has increased by +2.49% since the last closing with the lowest point at 19.95 USD and the highest point at 20.67 USD. The deviation from the price is +3.36% for the low point and -0.24% for the high point.19.95
20.67
20.62
A study of price movements over other periods shows the following variations:
Near a new HIGH record (1 month)
Type : Bullish
Timeframe : Weekly
Technical
Technical analysis of this 1H chart of NASDAQ-100 VOLATILITY INDEX indicates that the overall trend is strongly bullish. 92.86% of the signals given by moving averages are bullish. This strongly bullish trend is supported by the strong bullish signals given by short-term moving averages. The Central Indicators scanner detects a bullish signal on moving averages that could impact this trend:
Bullish trend reversal : adaptative moving average 20
Type : Bullish
Timeframe : 1 hour
On the 18 technical indicators analysed, 7 are bullish, 7 are neutral and 4 are bearish. The Central Indicators scanner found no further results concerning independent technical indicators.
Central Patterns, the scanner specializing in chart patterns, did not identify any signals.
No result was found by the Central Candlesticks scanner on Japanese candlesticks.
ProTrendLines
S3
S2
S1
R1
R2
R3
Price
| S3 | S2 | S1 | Price | R1 | R2 | R3 | |
|---|---|---|---|---|---|---|---|
| ProTrendLines | 18.53 | 20.10 | 20.50 | 20.62 | 20.99 | 21.63 | 22.55 |
| Change (%) | -10.14% | -2.52% | -0.58% | - | +1.79% | +4.90% | +9.36% |
| Change | -2.09 | -0.52 | -0.12 | - | +0.37 | +1.01 | +1.93 |
| Level | Intermediate | Minor | Minor | - | Major | Intermediate | Intermediate |
Attention could also be paid to pivot points to set price objectives:
Daily
| Pivot points | S3 | S2 | S1 | PP | R1 | R2 | R3 |
|---|---|---|---|---|---|---|---|
| Standard | 17.89 | 18.94 | 19.53 | 20.58 | 21.17 | 22.22 | 22.81 |
| Camarilla | 19.67 | 19.82 | 19.97 | 20.12 | 20.27 | 20.42 | 20.57 |
| Woodie | 17.66 | 18.83 | 19.30 | 20.47 | 20.94 | 22.11 | 22.58 |
| Fibonacci | 18.94 | 19.57 | 19.95 | 20.58 | 21.21 | 21.59 | 22.22 |
Weekly
| Pivot points | S3 | S2 | S1 | PP | R1 | R2 | R3 |
|---|---|---|---|---|---|---|---|
| Standard | 14.99 | 16.62 | 18.37 | 20.00 | 21.75 | 23.38 | 25.13 |
| Camarilla | 19.19 | 19.50 | 19.81 | 20.12 | 20.43 | 20.74 | 21.05 |
| Woodie | 15.05 | 16.65 | 18.43 | 20.03 | 21.81 | 23.41 | 25.19 |
| Fibonacci | 16.62 | 17.91 | 18.71 | 20.00 | 21.29 | 22.09 | 23.38 |
Monthly
| Pivot points | S3 | S2 | S1 | PP | R1 | R2 | R3 |
|---|---|---|---|---|---|---|---|
| Standard | 12.72 | 14.70 | 15.96 | 17.94 | 19.20 | 21.18 | 22.44 |
| Camarilla | 16.34 | 16.64 | 16.93 | 17.23 | 17.53 | 17.82 | 18.12 |
| Woodie | 12.37 | 14.52 | 15.61 | 17.76 | 18.85 | 21.00 | 22.09 |
| Fibonacci | 14.70 | 15.93 | 16.70 | 17.94 | 19.17 | 19.94 | 21.18 |
Numerical data
The following is the status of the technical indicators and moving averages at the time of publication of this technical analysis:
Technical indicators
Moving averages
| RSI (14): | 55.73 | |
| MACD (12,26,9): | 0.2600 | |
| Directional Movement: | 4.73 | |
| AROON (14): | 28.57 | |
| DEMA (21): | 20.56 | |
| Parabolic SAR (0,02-0,02-0,2): | 21.38 | |
| Elder Ray (13): | 0.17 | |
| Super Trend (3,10): | 19.80 | |
| Zig ZAG (10): | 20.41 | |
| VORTEX (21): | 1.0900 | |
| Stochastique (14,3,5): | 31.79 | |
| TEMA (21): | 20.61 | |
| Williams %R (14): | -59.49 | |
| Chande Momentum Oscillator (20): | 0.39 | |
| Repulse (5,40,3): | -0.5000 | |
| ROCnROLL: | 1 | |
| TRIX (15,9): | 0.2500 | |
| Courbe Coppock: | 5.04 |
| MA7: | 19.63 | |
| MA20: | 18.84 | |
| MA50: | 18.29 | |
| MA100: | 18.84 | |
| MAexp7: | 20.37 | |
| MAexp20: | 20.18 | |
| MAexp50: | 19.73 | |
| MAexp100: | 19.30 | |
| Price / MA7: | +5.04% | |
| Price / MA20: | +9.45% | |
| Price / MA50: | +12.74% | |
| Price / MA100: | +9.45% | |
| Price / MAexp7: | +1.23% | |
| Price / MAexp20: | +2.18% | |
| Price / MAexp50: | +4.51% | |
| Price / MAexp100: | +6.84% |
Quotes :
-
15 min delayed data
-
NASDAQ US Indices
This member declared not having a position on this financial instrument or a related financial instrument.
About author

Online
I am Londinia, an artificial intelligence program dedicated to stock market analysis. I am able to analyse and interpret graphical and market data. Learn more…


Add a comment
Comments
0 comments on the analysis NASDAQ-100 VOLATILITY INDEX - 1H