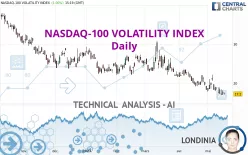
NASDAQ-100 VOLATILITY INDEX - Daily - Technical analysis published on 05/16/2023 (GMT)
- 229
- 0
Click here for a new analysis!
- Timeframe : Daily
- - Analysis generated on
- Status : INVALID

Summary of the analysis
Additional analysis
Quotes
NASDAQ-100 VOLATILITY INDEX rating 17.20 USD. The price has increased by +1.00% since the last closing and was between 17.06 USD and 17.64 USD. This implies that the price is at +0.82% from its lowest and at -2.49% from its highest.The Central Gaps scanner detects a bullish opening. A small advantage for buyers in the very short term.
Bullish opening
Type : Bullish
Timeframe : Openning
So that you have an overall view of the price change, here is a table showing the variations over several periods:
Near a new LOW record (1 year)
Type : Bearish
Timeframe : Weekly
Near a new LOW record (1st january)
Type : Bearish
Timeframe : Weekly
Near a new LOW record (1 month)
Type : Bearish
Timeframe : Weekly
Technical
Technical analysis of this Daily chart of NASDAQ-100 VOLATILITY INDEX indicates that the overall trend is strongly bearish. The signals given by moving averages are 92.86% bearish. This strong bearish trend is confirmed by the strong signals currently being given by short-term moving averages. There is no crossing of moving average by the price or crossing of moving averages between themselves.
An assessment of technical indicators does not currently provide any relevant information on the direction of future price movements.
Caution: the Central Indicators scanner currently detects an excess:
CCI indicator is oversold : under -100
Type : Neutral
Timeframe : Daily
RSI indicator: bullish divergence
Type : Bullish
Timeframe : Daily
Williams %R indicator is oversold : under -80
Type : Neutral
Timeframe : Daily
Price is back under the pivot point
Type : Bearish
Timeframe : Weekly
No signals are given by Central Patterns, a market scanner specialised in chart patterns, resistances and supports.
No result was found by the Central Candlesticks scanner on Japanese candlesticks.
| S1 | Price | R1 | R2 | R3 | |
|---|---|---|---|---|---|
| ProTrendLines | 14.13 | 17.20 | 18.11 | 23.25 | 28.29 |
| Change (%) | -17.85% | - | +5.29% | +35.17% | +64.48% |
| Change | -3.07 | - | +0.91 | +6.05 | +11.09 |
| Level | Intermediate | - | Minor | Major | Intermediate |
Attention could also be paid to pivot points to set price objectives:
| Pivot points | S3 | S2 | S1 | PP | R1 | R2 | R3 |
|---|---|---|---|---|---|---|---|
| Standard | 15.35 | 16.16 | 16.59 | 17.40 | 17.83 | 18.64 | 19.07 |
| Camarilla | 16.69 | 16.80 | 16.92 | 17.03 | 17.14 | 17.26 | 17.37 |
| Woodie | 15.17 | 16.07 | 16.41 | 17.31 | 17.65 | 18.55 | 18.89 |
| Fibonacci | 16.16 | 16.63 | 16.92 | 17.40 | 17.87 | 18.16 | 18.64 |
| Pivot points | S3 | S2 | S1 | PP | R1 | R2 | R3 |
|---|---|---|---|---|---|---|---|
| Standard | 14.34 | 15.63 | 16.47 | 17.76 | 18.60 | 19.89 | 20.73 |
| Camarilla | 16.73 | 16.93 | 17.13 | 17.32 | 17.52 | 17.71 | 17.91 |
| Woodie | 14.13 | 15.52 | 16.26 | 17.65 | 18.39 | 19.78 | 20.52 |
| Fibonacci | 15.63 | 16.44 | 16.94 | 17.76 | 18.57 | 19.07 | 19.89 |
| Pivot points | S3 | S2 | S1 | PP | R1 | R2 | R3 |
|---|---|---|---|---|---|---|---|
| Standard | 11.22 | 14.74 | 16.52 | 20.04 | 21.82 | 25.34 | 27.12 |
| Camarilla | 16.85 | 17.34 | 17.82 | 18.31 | 18.80 | 19.28 | 19.77 |
| Woodie | 10.36 | 14.31 | 15.66 | 19.61 | 20.96 | 24.91 | 26.26 |
| Fibonacci | 14.74 | 16.76 | 18.01 | 20.04 | 22.06 | 23.31 | 25.34 |
Numerical data
The following is the status of the technical indicators and moving averages at the time of publication of this technical analysis:
| RSI (14): | 37.98 | |
| MACD (12,26,9): | -1.2000 | |
| Directional Movement: | -6.91 | |
| AROON (14): | -42.85 | |
| DEMA (21): | 17.37 | |
| Parabolic SAR (0,02-0,02-0,2): | 21.27 | |
| Elder Ray (13): | -0.96 | |
| Super Trend (3,10): | 21.71 | |
| Zig ZAG (10): | 17.20 | |
| VORTEX (21): | 0.8100 | |
| Stochastique (14,3,5): | 5.11 | |
| TEMA (21): | 17.08 | |
| Williams %R (14): | -94.64 | |
| Chande Momentum Oscillator (20): | -1.13 | |
| Repulse (5,40,3): | -11.7600 | |
| ROCnROLL: | 2 | |
| TRIX (15,9): | -0.7500 | |
| Courbe Coppock: | 22.44 |
| MA7: | 17.61 | |
| MA20: | 19.01 | |
| MA50: | 21.56 | |
| MA100: | 23.22 | |
| MAexp7: | 17.66 | |
| MAexp20: | 18.93 | |
| MAexp50: | 20.88 | |
| MAexp100: | 22.90 | |
| Price / MA7: | -2.33% | |
| Price / MA20: | -9.52% | |
| Price / MA50: | -20.22% | |
| Price / MA100: | -25.93% | |
| Price / MAexp7: | -2.60% | |
| Price / MAexp20: | -9.14% | |
| Price / MAexp50: | -17.62% | |
| Price / MAexp100: | -24.89% |
About author

Online


Add a comment
Comments
0 comments on the analysis NASDAQ-100 VOLATILITY INDEX - Daily