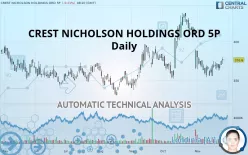
CREST NICHOLSON HOLDINGS ORD 5P - Daily - Technical analysis published on 11/27/2019 (GMT)
- 336
- 0
- Who voted?
Click here for a new analysis!
- Timeframe : Daily
- - Analysis generated on
- Status : TARGET REACHED

Summary of the analysis

Additional analysis
Quotes
The CREST NICHOLSON HOLDINGS ORD 5P rating is 376.6 GBX. The price registered a decrease of -0.21% on the session and was between 376.6 GBX and 376.6 GBX. This implies that the price is at 0% from its lowest and at 0% from its highest.The Central Gaps scanner detects a bullish opening. A small advantage for buyers in the very short term.
Bullish opening
Type : Bullish
Timeframe : Openning
So that you have an overall view of the price change, here is a table showing the variations over several periods:
Technical
A technical analysis in Daily of this CREST NICHOLSON HOLDINGS ORD 5P chart shows a bullish trend. The signals given by moving averages are 67.86% bullish. This bullish trend could slow down given the neutral signals currently being given by short-term moving averages. The Central Indicators scanner detects a bullish signal on moving averages that could impact this trend:
Bullish price crossover with adaptative moving average 100
Type : Bullish
Timeframe : Daily
In fact, 11 technical indicators on 18 studied are currently positioned bullish. Caution: the Central Indicators scanner currently detects an excess:
Williams %R indicator is overbought : over -20
Type : Neutral
Timeframe : Daily
Pivot points : price is over resistance 1
Type : Neutral
Timeframe : Daily
Pivot points : price is over resistance 1
Type : Neutral
Timeframe : Weekly
MACD crosses UP its Moving Average
Type : Bullish
Timeframe : Daily
An analysis of the price chart with the Central Patterns scanner (detector of chart patterns and resistances and supports) shows several results that can have an impact on the price change:
Near horizontal resistance
Type : Bearish
Timeframe : Daily
Resistance of channel is broken
Type : Bullish
Timeframe : Daily
No result was found by the Central Candlesticks scanner on Japanese candlesticks.
| S3 | S2 | S1 | Price | R1 | R2 | R3 | |
|---|---|---|---|---|---|---|---|
| ProTrendLines | 351.5 | 359.6 | 370.9 | 376.6 | 380.2 | 404.8 | 435.2 |
| Change (%) | -6.66% | -4.51% | -1.51% | - | +0.96% | +7.49% | +15.56% |
| Change | -25.1 | -17.0 | -5.7 | - | +3.6 | +28.2 | +58.6 |
| Level | Major | Intermediate | Major | - | Intermediate | Intermediate | Intermediate |
Attention could also be paid to pivot points to set price objectives:
| Pivot points | S3 | S2 | S1 | PP | R1 | R2 | R3 |
|---|---|---|---|---|---|---|---|
| Standard | 365.3 | 367.7 | 371.3 | 373.7 | 377.3 | 379.7 | 383.3 |
| Camarilla | 373.4 | 373.9 | 374.5 | 375.0 | 375.6 | 376.1 | 376.7 |
| Woodie | 366.0 | 368.0 | 372.0 | 374.0 | 378.0 | 380.0 | 384.0 |
| Fibonacci | 367.5 | 370.8 | 372.9 | 373.7 | 376.0 | 377.4 | 379.7 |
| Pivot points | S3 | S2 | S1 | PP | R1 | R2 | R3 |
|---|---|---|---|---|---|---|---|
| Standard | 351.7 | 357.1 | 363.9 | 369.3 | 376.1 | 381.5 | 388.3 |
| Camarilla | 367.2 | 368.4 | 369.5 | 370.6 | 371.7 | 372.8 | 374.0 |
| Woodie | 352.3 | 357.5 | 364.5 | 369.7 | 376.7 | 381.9 | 388.9 |
| Fibonacci | 357.1 | 361.8 | 364.7 | 369.3 | 374.0 | 376.9 | 381.5 |
| Pivot points | S3 | S2 | S1 | PP | R1 | R2 | R3 |
|---|---|---|---|---|---|---|---|
| Standard | 263.0 | 307.6 | 348.0 | 392.6 | 433.0 | 477.6 | 518.0 |
| Camarilla | 365.0 | 372.8 | 380.6 | 388.4 | 396.2 | 404.0 | 411.8 |
| Woodie | 260.9 | 306.6 | 345.9 | 391.6 | 430.9 | 476.6 | 515.9 |
| Fibonacci | 307.6 | 340.1 | 360.1 | 392.6 | 425.1 | 445.1 | 477.6 |
Numerical data
The following is the status of technical indicators and moving averages registered at the time this technical analysis was created:
| RSI (14): | 50.20 | |
| MACD (12,26,9): | -4.7000 | |
| Directional Movement: | -2.2 | |
| AROON (14): | 78.6 | |
| DEMA (21): | 369.2 | |
| Parabolic SAR (0,02-0,02-0,2): | 381.7 | |
| Elder Ray (13): | 2.8 | |
| Super Trend (3,10): | 397.5 | |
| Zig ZAG (10): | 377.4 | |
| VORTEX (21): | 0.9000 | |
| Stochastique (14,3,5): | 85.70 | |
| TEMA (21): | 364.4 | |
| Williams %R (14): | -9.30 | |
| Chande Momentum Oscillator (20): | 18.0 | |
| Repulse (5,40,3): | 3.3000 | |
| ROCnROLL: | 1 | |
| TRIX (15,9): | -0.2000 | |
| Courbe Coppock: | 3.70 |
| MA7: | 372.4 | |
| MA20: | 372.0 | |
| MA50: | 384.6 | |
| MA100: | 365.5 | |
| MAexp7: | 373.2 | |
| MAexp20: | 375.4 | |
| MAexp50: | 377.1 | |
| MAexp100: | 370.6 | |
| Price / MA7: | +1.13% | |
| Price / MA20: | +1.24% | |
| Price / MA50: | -2.08% | |
| Price / MA100: | +3.04% | |
| Price / MAexp7: | +0.91% | |
| Price / MAexp20: | +0.32% | |
| Price / MAexp50: | -0.13% | |
| Price / MAexp100: | +1.62% |
News
The latest news and videos published on CREST NICHOLSON HOLDINGS ORD 5P at the time of the analysis were as follows:
-
 Boss of Crest Nicholson tells us about the housing measures in the Budget
-
Crest Nicholson
-
Crest Nicholson
-
Crest Nicholson
About author

Online


Add a comment
Comments
0 comments on the analysis CREST NICHOLSON HOLDINGS ORD 5P - Daily