NATURHOUSE - Daily - Technical analysis published on 08/06/2024 (GMT)
- 120
- 0
Click here for a new analysis!
- Timeframe : Daily
- - Analysis generated on
- Status : TARGET REACHED

Summary of the analysis

Additional analysis
Quotes
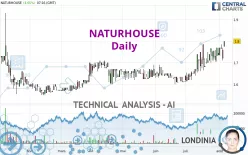
The NATURHOUSE rating is 1.800 EUR. The price has increased by +4.65% since the last closing and was traded between 1.775 EUR and 1.800 EUR over the period. The price is currently at +1.41% from its lowest and 0% from its highest.A study of price movements over other periods shows the following variations:
Near a new HIGH record (1 year)
Type : Bullish
Timeframe : Weekly
Near a new HIGH record (1st january)
Type : Bullish
Timeframe : Weekly
Near a new HIGH record (1 month)
Type : Bullish
Timeframe : Weekly
Technical
Technical analysis of this Daily chart of NATURHOUSE indicates that the overall trend is strongly bullish. 89.29% of the signals given by moving averages are bullish. The slightly bullish signals given by the short-term moving averages show a weakening of the global trend. The Central Indicators market scanner is currently detecting a bullish signal that could impact this trend:
Bullish price crossover with Moving Average 20
Type : Bullish
Timeframe : Daily
The technical indicators are generally neutral. They do not provide relevant information on the direction of future price movements.
Central Indicators, the scanner specialised in technical indicators, has identified these signals:
Pivot points : price is over resistance 2
Type : Neutral
Timeframe : Daily
Price is back under the pivot point
Type : Bearish
Timeframe : Weekly
No signals are given by Central Patterns, a market scanner specialised in chart patterns, resistances and supports.
No result was found by the Central Candlesticks scanner on Japanese candlesticks.
| S3 | S2 | S1 | Price | R1 | R2 | R3 | |
|---|---|---|---|---|---|---|---|
| ProTrendLines | 1.707 | 1.740 | 1.770 | 1.800 | 1.836 | 2.331 | 2.806 |
| Change (%) | -5.17% | -3.33% | -1.67% | - | +2.00% | +29.50% | +55.89% |
| Change | -0.093 | -0.060 | -0.030 | - | +0.036 | +0.531 | +1.006 |
| Level | Major | Minor | Intermediate | - | Major | Minor | Minor |
To determine price objectives, it is also possible to use the pivot points. Here is the price position in relation to pivot points:
| Pivot points | S3 | S2 | S1 | PP | R1 | R2 | R3 |
|---|---|---|---|---|---|---|---|
| Standard | 1.637 | 1.673 | 1.697 | 1.733 | 1.757 | 1.793 | 1.817 |
| Camarilla | 1.704 | 1.709 | 1.715 | 1.720 | 1.726 | 1.731 | 1.737 |
| Woodie | 1.630 | 1.670 | 1.690 | 1.730 | 1.750 | 1.790 | 1.810 |
| Fibonacci | 1.673 | 1.696 | 1.710 | 1.733 | 1.756 | 1.770 | 1.793 |
| Pivot points | S3 | S2 | S1 | PP | R1 | R2 | R3 |
|---|---|---|---|---|---|---|---|
| Standard | 1.638 | 1.672 | 1.718 | 1.752 | 1.798 | 1.832 | 1.878 |
| Camarilla | 1.743 | 1.750 | 1.758 | 1.765 | 1.772 | 1.780 | 1.787 |
| Woodie | 1.645 | 1.675 | 1.725 | 1.755 | 1.805 | 1.835 | 1.885 |
| Fibonacci | 1.672 | 1.702 | 1.721 | 1.752 | 1.782 | 1.801 | 1.832 |
| Pivot points | S3 | S2 | S1 | PP | R1 | R2 | R3 |
|---|---|---|---|---|---|---|---|
| Standard | 1.460 | 1.535 | 1.635 | 1.710 | 1.810 | 1.885 | 1.985 |
| Camarilla | 1.687 | 1.703 | 1.719 | 1.735 | 1.751 | 1.767 | 1.783 |
| Woodie | 1.473 | 1.541 | 1.648 | 1.716 | 1.823 | 1.891 | 1.998 |
| Fibonacci | 1.535 | 1.602 | 1.643 | 1.710 | 1.777 | 1.818 | 1.885 |
Numerical data
The following is the status of technical indicators and moving averages registered at the time this technical analysis was created:
| RSI (14): | 51.69 | |
| MACD (12,26,9): | 0.0250 | |
| Directional Movement: | 9.878 | |
| AROON (14): | 0 | |
| DEMA (21): | 1.755 | |
| Parabolic SAR (0,02-0,02-0,2): | 1.707 | |
| Elder Ray (13): | 0.005 | |
| Super Trend (3,10): | 1.640 | |
| Zig ZAG (10): | 1.720 | |
| VORTEX (21): | 1.0320 | |
| Stochastique (14,3,5): | 72.39 | |
| TEMA (21): | 1.765 | |
| Williams %R (14): | -54.17 | |
| Chande Momentum Oscillator (20): | 0.035 | |
| Repulse (5,40,3): | -1.7470 | |
| ROCnROLL: | -1 | |
| TRIX (15,9): | 0.2290 | |
| Courbe Coppock: | 6.96 |
| MA7: | 1.749 | |
| MA20: | 1.723 | |
| MA50: | 1.672 | |
| MA100: | 1.650 | |
| MAexp7: | 1.744 | |
| MAexp20: | 1.722 | |
| MAexp50: | 1.685 | |
| MAexp100: | 1.654 | |
| Price / MA7: | +2.92% | |
| Price / MA20: | +4.47% | |
| Price / MA50: | +7.66% | |
| Price / MA100: | +9.09% | |
| Price / MAexp7: | +3.21% | |
| Price / MAexp20: | +4.53% | |
| Price / MAexp50: | +6.82% | |
| Price / MAexp100: | +8.83% |
News
Don't forget to follow the news on NATURHOUSE. At the time of publication of this analysis, the latest news was as follows:
About author
Online


Add a comment
Comments
0 comments on the analysis NATURHOUSE - Daily