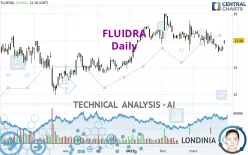
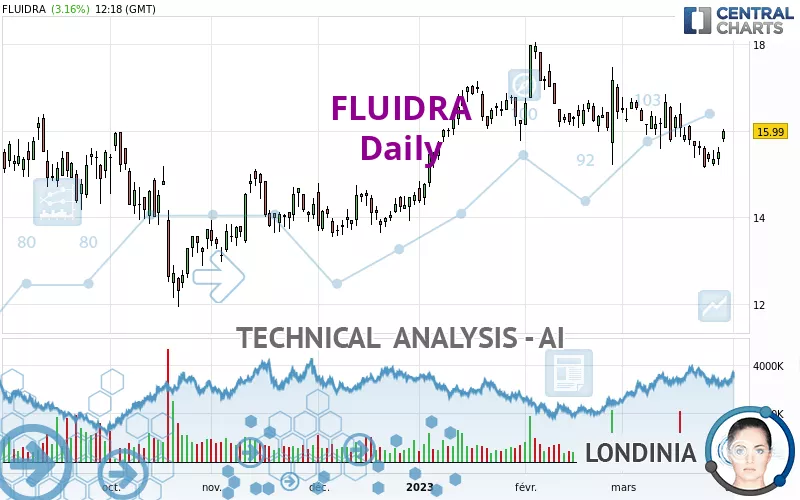
FLUIDRA - Daily - Technical analysis published on 03/30/2023 (GMT)
- 170
- 0
- Timeframe : Daily
- - Analysis generated on
- Status : NEUTRAL
Summary of the analysis

Additional analysis
Quotes
The FLUIDRA rating is 15.99 EUR. The price has increased by +3.16% since the last closing and was traded between 15.75 EUR and 16.03 EUR over the period. The price is currently at +1.52% from its lowest and -0.25% from its highest.A bullish gap was detected at the opening by the Central Gaps scanner. There are a lot of buyers and they have the upper hand in the very short term.
Opening Gap UP
Type : Bullish
Timeframe : Openning
So that you have an overall view of the price change, here is a table showing the variations over several periods:
Near a new LOW record (1 month)
Type : Bearish
Timeframe : Weekly
Technical
A technical analysis in Daily of this FLUIDRA chart shows a slightly bullish trend. 57.14% of the signals given by moving averages are bullish. As the signals currently given by short-term moving averages are rather neutral, the overall trend could quickly return to neutral as well. An assessment of moving averages reveals several bullish signals that could impact this trend:
Bullish price crossover with Moving Average 20
Type : Bullish
Timeframe : Daily
Bullish price crossover with Moving Average 100
Type : Bullish
Timeframe : Daily
In fact, Central Analyzer took into account 18 technical indicators and the result was as follows: 8 are bullish, 5 are neutral and 5 are bearish. Central Indicators, the scanner specialised in technical indicators, has identified these signals:
Pivot points : price is over resistance 1
Type : Neutral
Timeframe : Weekly
Pivot points : price is over resistance 2
Type : Neutral
Timeframe : Daily
RSI indicator is back over 50
Type : Bullish
Timeframe : Daily
The Central Patterns scanner, which studies chart patterns, resistances and supports, has identified this signal:
Near resistance of channel
Type : Bearish
Timeframe : Daily
The presence of a bullish Japanese candlestick pattern detected by Central Candlesticks that could cause a very short term rebound was also detected:
Upside gap
Type : Bullish
Timeframe : Daily
| S3 | S2 | S1 | Price | R1 | R2 | R3 | |
|---|---|---|---|---|---|---|---|
| ProTrendLines | 12.81 | 13.89 | 14.89 | 15.99 | 16.63 | 18.01 | 19.20 |
| Change (%) | -19.89% | -13.13% | -6.88% | - | +4.00% | +12.63% | +20.08% |
| Change | -3.18 | -2.10 | -1.10 | - | +0.64 | +2.02 | +3.21 |
| Level | Major | Intermediate | Major | - | Major | Intermediate | Minor |
Attention could also be paid to pivot points to set price objectives:
| Pivot points | S3 | S2 | S1 | PP | R1 | R2 | R3 |
|---|---|---|---|---|---|---|---|
| Standard | 14.83 | 15.01 | 15.26 | 15.44 | 15.69 | 15.87 | 16.12 |
| Camarilla | 15.38 | 15.42 | 15.46 | 15.50 | 15.54 | 15.58 | 15.62 |
| Woodie | 14.86 | 15.03 | 15.29 | 15.46 | 15.72 | 15.89 | 16.15 |
| Fibonacci | 15.01 | 15.18 | 15.28 | 15.44 | 15.61 | 15.71 | 15.87 |
| Pivot points | S3 | S2 | S1 | PP | R1 | R2 | R3 |
|---|---|---|---|---|---|---|---|
| Standard | 13.81 | 14.47 | 14.82 | 15.48 | 15.83 | 16.49 | 16.84 |
| Camarilla | 14.89 | 14.99 | 15.08 | 15.17 | 15.26 | 15.36 | 15.45 |
| Woodie | 13.66 | 14.39 | 14.67 | 15.40 | 15.68 | 16.41 | 16.69 |
| Fibonacci | 14.47 | 14.86 | 15.09 | 15.48 | 15.87 | 16.10 | 16.49 |
| Pivot points | S3 | S2 | S1 | PP | R1 | R2 | R3 |
|---|---|---|---|---|---|---|---|
| Standard | 12.25 | 13.74 | 15.08 | 16.57 | 17.91 | 19.40 | 20.74 |
| Camarilla | 15.65 | 15.91 | 16.17 | 16.43 | 16.69 | 16.95 | 17.21 |
| Woodie | 12.19 | 13.70 | 15.02 | 16.53 | 17.85 | 19.36 | 20.68 |
| Fibonacci | 13.74 | 14.82 | 15.49 | 16.57 | 17.65 | 18.32 | 19.40 |
Numerical data
The following is the status of technical indicators and moving averages registered at the time this technical analysis was created:
| RSI (14): | 50.39 | |
| MACD (12,26,9): | -0.2200 | |
| Directional Movement: | 0.20 | |
| AROON (14): | -57.14 | |
| DEMA (21): | 15.61 | |
| Parabolic SAR (0,02-0,02-0,2): | 16.80 | |
| Elder Ray (13): | 0.13 | |
| Super Trend (3,10): | 16.83 | |
| Zig ZAG (10): | 16.00 | |
| VORTEX (21): | 0.8600 | |
| Stochastique (14,3,5): | 27.94 | |
| TEMA (21): | 15.42 | |
| Williams %R (14): | -49.71 | |
| Chande Momentum Oscillator (20): | -0.66 | |
| Repulse (5,40,3): | 1.5500 | |
| ROCnROLL: | 1 | |
| TRIX (15,9): | -0.1800 | |
| Courbe Coppock: | 8.64 |
| MA7: | 15.52 | |
| MA20: | 15.97 | |
| MA50: | 16.35 | |
| MA100: | 15.53 | |
| MAexp7: | 15.64 | |
| MAexp20: | 15.88 | |
| MAexp50: | 15.99 | |
| MAexp100: | 15.93 | |
| Price / MA7: | +3.03% | |
| Price / MA20: | +0.13% | |
| Price / MA50: | -2.20% | |
| Price / MA100: | +2.96% | |
| Price / MAexp7: | +2.24% | |
| Price / MAexp20: | +0.69% | |
| Price / MAexp50: | -0% | |
| Price / MAexp100: | +0.38% |
News
The latest news and videos published on FLUIDRA at the time of the analysis were as follows:
- Fluidra Closed 2022 with €2,389 Million Sales, up 9% on 2021
- Fluidra Reaches an Agreement to Acquire Meranus Group
- Fluidra Sales Grew by 15% in the First Nine Months of the Year
- Fluidra provides update on its financial performance in Q3 and full-year outlook
- Clara Valera, New Investor Relations and Business Development Director at Fluidra
About author
Online


Add a comment
Comments
0 comments on the analysis FLUIDRA - Daily