FLUIDRA - Daily - Technical analysis published on 01/16/2023 (GMT)
- 156
- 0
Click here for a new analysis!
- Timeframe : Daily
- - Analysis generated on
- Status : INVALID
Summary of the analysis

Additional analysis
Quotes
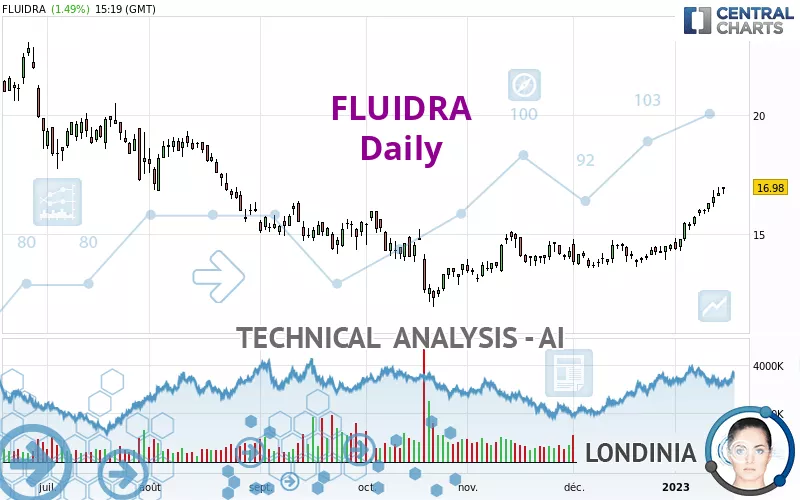
FLUIDRA rating 16.98 EUR. The price registered an increase of +1.49% on the session with the lowest point at 16.67 EUR and the highest point at 16.98 EUR. The deviation from the price is +1.86% for the low point and 0% for the high point.The Central Gaps scanner detects a bullish opening marking the presence of buyers ahead of sellers at the opening but not sufficiently marked to allow the price to register a quotation gap.
Bullish opening
Type : Bullish
Timeframe : Openning
So that you have an overall view of the price change, here is a table showing the variations over several periods:
New HIGH record (1st january)
Type : Bullish
Timeframe : Weekly
New HIGH record (1 month)
Type : Bullish
Timeframe : Weekly
Technical
A technical analysis in Daily of this FLUIDRA chart shows a strongly bullish trend. 89.29% of the signals given by moving averages are bullish. This strongly bullish trend is supported by the strong bullish signals given by short-term moving averages. The Central Indicators scanner does not detect any result on moving averages that would impact this trend.
Technical indicators are strongly bullish, suggesting that the price increase should continue.
Caution: the Central Indicators scanner currently detects an excess:
RSI indicator is overbought : over 70
Type : Neutral
Timeframe : Daily
CCI indicator is overbought : over 100
Type : Neutral
Timeframe : Daily
Williams %R indicator is overbought : over -20
Type : Neutral
Timeframe : Daily
Pivot points : price is over resistance 1
Type : Neutral
Timeframe : Daily
Central Patterns, the market scanner focusing on chart patterns, resistances and supports found these results:
Near horizontal resistance
Type : Bearish
Timeframe : Daily
Resistance of channel is broken
Type : Bullish
Timeframe : Daily
The Central Candlesticks scanner, specialised in Japanese candlesticks, did not identify any signals.
| S3 | S2 | S1 | Price | R1 | R2 | R3 | |
|---|---|---|---|---|---|---|---|
| ProTrendLines | 12.81 | 13.88 | 16.56 | 16.98 | 18.07 | 19.19 | 21.90 |
| Change (%) | -24.56% | -18.26% | -2.47% | - | +6.42% | +13.02% | +28.98% |
| Change | -4.17 | -3.10 | -0.42 | - | +1.09 | +2.21 | +4.92 |
| Level | Major | Major | Intermediate | - | Minor | Minor | Intermediate |
Attention could also be paid to pivot points to set price objectives:
| Pivot points | S3 | S2 | S1 | PP | R1 | R2 | R3 |
|---|---|---|---|---|---|---|---|
| Standard | 16.19 | 16.38 | 16.56 | 16.75 | 16.93 | 17.12 | 17.30 |
| Camarilla | 16.63 | 16.66 | 16.70 | 16.73 | 16.76 | 16.80 | 16.83 |
| Woodie | 16.18 | 16.38 | 16.55 | 16.75 | 16.92 | 17.12 | 17.29 |
| Fibonacci | 16.38 | 16.53 | 16.61 | 16.75 | 16.90 | 16.98 | 17.12 |
| Pivot points | S3 | S2 | S1 | PP | R1 | R2 | R3 |
|---|---|---|---|---|---|---|---|
| Standard | 14.80 | 15.28 | 16.00 | 16.48 | 17.20 | 17.68 | 18.40 |
| Camarilla | 16.40 | 16.51 | 16.62 | 16.73 | 16.84 | 16.95 | 17.06 |
| Woodie | 14.93 | 15.34 | 16.13 | 16.54 | 17.33 | 17.74 | 18.53 |
| Fibonacci | 15.28 | 15.74 | 16.02 | 16.48 | 16.94 | 17.22 | 17.68 |
| Pivot points | S3 | S2 | S1 | PP | R1 | R2 | R3 |
|---|---|---|---|---|---|---|---|
| Standard | 12.53 | 13.04 | 13.78 | 14.29 | 15.03 | 15.54 | 16.28 |
| Camarilla | 14.18 | 14.29 | 14.41 | 14.52 | 14.64 | 14.75 | 14.86 |
| Woodie | 12.65 | 13.10 | 13.90 | 14.35 | 15.15 | 15.60 | 16.40 |
| Fibonacci | 13.04 | 13.52 | 13.81 | 14.29 | 14.77 | 15.06 | 15.54 |
Numerical data
The following is the status of the technical indicators and moving averages at the time of publication of this technical analysis:
| RSI (14): | 79.70 | |
| MACD (12,26,9): | 0.6700 | |
| Directional Movement: | 28.50 | |
| AROON (14): | 78.57 | |
| DEMA (21): | 16.22 | |
| Parabolic SAR (0,02-0,02-0,2): | 15.38 | |
| Elder Ray (13): | 0.99 | |
| Super Trend (3,10): | 15.53 | |
| Zig ZAG (10): | 16.94 | |
| VORTEX (21): | 1.2500 | |
| Stochastique (14,3,5): | 94.19 | |
| TEMA (21): | 16.69 | |
| Williams %R (14): | -0.33 | |
| Chande Momentum Oscillator (20): | 2.46 | |
| Repulse (5,40,3): | 3.7400 | |
| ROCnROLL: | 1 | |
| TRIX (15,9): | 0.4500 | |
| Courbe Coppock: | 29.49 |
| MA7: | 16.32 | |
| MA20: | 15.10 | |
| MA50: | 14.53 | |
| MA100: | 14.38 | |
| MAexp7: | 16.32 | |
| MAexp20: | 15.44 | |
| MAexp50: | 14.84 | |
| MAexp100: | 15.28 | |
| Price / MA7: | +4.04% | |
| Price / MA20: | +12.45% | |
| Price / MA50: | +16.86% | |
| Price / MA100: | +18.08% | |
| Price / MAexp7: | +4.04% | |
| Price / MAexp20: | +9.97% | |
| Price / MAexp50: | +14.42% | |
| Price / MAexp100: | +11.13% |
News
Don't forget to follow the news on FLUIDRA. At the time of publication of this analysis, the latest news was as follows:
- Fluidra Reaches an Agreement to Acquire Meranus Group
- Fluidra Sales Grew by 15% in the First Nine Months of the Year
- Fluidra provides update on its financial performance in Q3 and full-year outlook
- Clara Valera, New Investor Relations and Business Development Director at Fluidra
- Fluidra Sales Grew by 22% in the First Half of the Year
About author
Online


Add a comment
Comments
0 comments on the analysis FLUIDRA - Daily