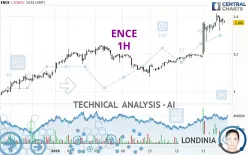
ENCE - 1H - Technical analysis published on 01/20/2025 (GMT)
- 80
- 0
Click here for a new analysis!
- Timeframe : 1H
- - Analysis generated on
- Status : LEVEL MAINTAINED

Summary of the analysis

Additional analysis
Quotes
The ENCE rating is 3.366 EUR. On the day, this instrument lost -0.06% with the lowest point at 3.322 EUR and the highest point at 3.418 EUR. The deviation from the price is +1.32% for the low point and -1.52% for the high point.The Central Gaps scanner detects the formation of a bullish gap marking the strong presence of buyers against sellers at the opening. This formed a quotation gap.
Opening Gap UP
Type : Bullish
Timeframe : Openning
So that you have an overall view of the price change, here is a table showing the variations over several periods:
Near a new HIGH record (5 years)
Type : Bullish
Timeframe : Weekly
Near a new HIGH record (1 year)
Type : Bullish
Timeframe : Weekly
New HIGH record (1st january)
Type : Bullish
Timeframe : Weekly
New HIGH record (1 month)
Type : Bullish
Timeframe : Weekly
Technical
Technical analysis of ENCE in 1H shows a strongly overall bullish trend. The signals given by the moving averages are 92.86% bullish. This strong bullish trend is confirmed by the strong signals currently being given by short-term moving averages. There is no crossing of moving average by the price or crossing of moving averages between themselves.
In fact, 11 technical indicators on 18 studied are currently bullish. Central Indicators, the detector scanner for these technical indicators recently detected a signal:
MACD crosses DOWN its Moving Average
Type : Bearish
Timeframe : 1 hour
The Central Patterns scanner, which studies chart patterns, resistances and supports, has identified these signals:
Near horizontal resistance
Type : Bearish
Timeframe : 1 hour
Near resistance of channel
Type : Bearish
Timeframe : 1 hour
There is also a Japanese candlestick pattern detected by Central Candlesticks that could mark the end of the current short-term trend:
Doji
Type : Neutral
Timeframe : 1 hour
| S3 | S2 | S1 | Price | R1 | R2 | R3 | |
|---|---|---|---|---|---|---|---|
| ProTrendLines | 3.095 | 3.147 | 3.239 | 3.366 | 3.374 | 3.456 | 5.021 |
| Change (%) | -8.05% | -6.51% | -3.77% | - | +0.24% | +2.67% | +49.17% |
| Change | -0.271 | -0.219 | -0.127 | - | +0.008 | +0.090 | +1.655 |
| Level | Major | Minor | Major | - | Intermediate | Major | Minor |
Pivot points can also be used to set your price objectives. Here is the price situation in relation to pivot points:
| Pivot points | S3 | S2 | S1 | PP | R1 | R2 | R3 |
|---|---|---|---|---|---|---|---|
| Standard | 3.077 | 3.137 | 3.253 | 3.313 | 3.429 | 3.489 | 3.605 |
| Camarilla | 3.320 | 3.336 | 3.352 | 3.368 | 3.384 | 3.400 | 3.416 |
| Woodie | 3.104 | 3.151 | 3.280 | 3.327 | 3.456 | 3.503 | 3.632 |
| Fibonacci | 3.137 | 3.205 | 3.246 | 3.313 | 3.381 | 3.422 | 3.489 |
| Pivot points | S3 | S2 | S1 | PP | R1 | R2 | R3 |
|---|---|---|---|---|---|---|---|
| Standard | 2.877 | 2.977 | 3.173 | 3.273 | 3.469 | 3.569 | 3.765 |
| Camarilla | 3.287 | 3.314 | 3.341 | 3.368 | 3.395 | 3.422 | 3.449 |
| Woodie | 2.924 | 3.001 | 3.220 | 3.297 | 3.516 | 3.593 | 3.812 |
| Fibonacci | 2.977 | 3.090 | 3.160 | 3.273 | 3.386 | 3.456 | 3.569 |
| Pivot points | S3 | S2 | S1 | PP | R1 | R2 | R3 |
|---|---|---|---|---|---|---|---|
| Standard | 2.389 | 2.537 | 2.817 | 2.965 | 3.245 | 3.393 | 3.673 |
| Camarilla | 2.980 | 3.020 | 3.059 | 3.098 | 3.137 | 3.177 | 3.216 |
| Woodie | 2.456 | 2.570 | 2.884 | 2.998 | 3.312 | 3.426 | 3.740 |
| Fibonacci | 2.537 | 2.700 | 2.801 | 2.965 | 3.128 | 3.229 | 3.393 |
Numerical data
The following is the status of technical indicators and moving averages registered at the time this technical analysis was created:
| RSI (14): | 68.88 | |
| MACD (12,26,9): | 0.0490 | |
| Directional Movement: | 8.827 | |
| AROON (14): | 64.286 | |
| DEMA (21): | 3.391 | |
| Parabolic SAR (0,02-0,02-0,2): | 3.283 | |
| Elder Ray (13): | 0.022 | |
| Super Trend (3,10): | 3.288 | |
| Zig ZAG (10): | 3.374 | |
| VORTEX (21): | 1.2020 | |
| Stochastique (14,3,5): | 81.19 | |
| TEMA (21): | 3.409 | |
| Williams %R (14): | -21.36 | |
| Chande Momentum Oscillator (20): | 0.034 | |
| Repulse (5,40,3): | 0.2240 | |
| ROCnROLL: | 1 | |
| TRIX (15,9): | 0.2240 | |
| Courbe Coppock: | 7.50 |
| MA7: | 3.214 | |
| MA20: | 3.149 | |
| MA50: | 2.967 | |
| MA100: | 2.937 | |
| MAexp7: | 3.370 | |
| MAexp20: | 3.327 | |
| MAexp50: | 3.258 | |
| MAexp100: | 3.204 | |
| Price / MA7: | +4.73% | |
| Price / MA20: | +6.89% | |
| Price / MA50: | +13.45% | |
| Price / MA100: | +14.61% | |
| Price / MAexp7: | -0.12% | |
| Price / MAexp20: | +1.17% | |
| Price / MAexp50: | +3.31% | |
| Price / MAexp100: | +5.06% |
News
The latest news and videos published on ENCE at the time of the analysis were as follows:
About author
Online


Add a comment
Comments
0 comments on the analysis ENCE - 1H