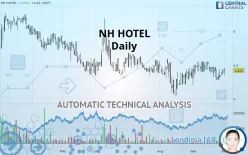
MINOR HOTELS - Daily - Technical analysis published on 10/01/2019 (GMT)
- 221
- 0
- Who voted?
Click here for a new analysis!
- Timeframe : Daily
- - Analysis generated on
- Status : LEVEL MAINTAINED

Summary of the analysis

Additional analysis
Quotes
NH HOTEL rating 4.422 EUR. The price registered an increase of +1.05% on the session and was between 4.352 EUR and 4.446 EUR. This implies that the price is at +1.61% from its lowest and at -0.54% from its highest.The Central Gaps scanner detects the formation of a bullish gap marking the strong presence of buyers against sellers at the opening. This formed a quotation gap.
Opening Gap UP
Type : Bullish
Timeframe : Openning
A study of price movements over other periods shows the following variations:
Technical
A technical analysis in Daily of this NH HOTEL chart shows a bearish trend. The signals given by moving averages are 64.29% bearish. This bearish trend could slow down given the neutral signals currently being given by short-term moving averages. There is no crossing of moving average by the price or crossing of moving averages between themselves.
An assessment of technical indicators does not currently provide any relevant information on the direction of future price movements.
Central Indicators, the detector scanner for these technical indicators has recently detected several signals:
Pivot points : price is over resistance 1
Type : Neutral
Timeframe : Daily
Ichimoku - Bearish crossover : Tenkan & Kijun
Type : Bearish
Timeframe : Daily
Price is back under the pivot point
Type : Bearish
Timeframe : Daily
Price is back under the pivot point
Type : Bearish
Timeframe : Weekly
The Central Patterns scanner, which studies chart patterns, resistances and supports, has identified this signal:
Near resistance of triangle
Type : Bearish
Timeframe : Daily
The Central Candlesticks scanner which studies Japanese candlesticks did not detect anything.
| S3 | S2 | S1 | Price | R1 | R2 | R3 | |
|---|---|---|---|---|---|---|---|
| ProTrendLines | 4.051 | 4.182 | 4.298 | 4.422 | 4.548 | 4.750 | 4.880 |
| Change (%) | -8.39% | -5.43% | -2.80% | - | +2.85% | +7.42% | +10.36% |
| Change | -0.371 | -0.240 | -0.124 | - | +0.126 | +0.328 | +0.458 |
| Level | Major | Minor | Intermediate | - | Minor | Minor | Major |
Attention could also be paid to pivot points to set price objectives:
| Pivot points | S3 | S2 | S1 | PP | R1 | R2 | R3 |
|---|---|---|---|---|---|---|---|
| Standard | 4.258 | 4.304 | 4.340 | 4.386 | 4.422 | 4.468 | 4.504 |
| Camarilla | 4.354 | 4.361 | 4.369 | 4.376 | 4.384 | 4.391 | 4.399 |
| Woodie | 4.253 | 4.302 | 4.335 | 4.384 | 4.417 | 4.466 | 4.499 |
| Fibonacci | 4.304 | 4.335 | 4.355 | 4.386 | 4.417 | 4.437 | 4.468 |
| Pivot points | S3 | S2 | S1 | PP | R1 | R2 | R3 |
|---|---|---|---|---|---|---|---|
| Standard | 4.076 | 4.178 | 4.264 | 4.366 | 4.452 | 4.554 | 4.640 |
| Camarilla | 4.298 | 4.316 | 4.333 | 4.350 | 4.367 | 4.385 | 4.402 |
| Woodie | 4.068 | 4.174 | 4.256 | 4.362 | 4.444 | 4.550 | 4.632 |
| Fibonacci | 4.178 | 4.250 | 4.294 | 4.366 | 4.438 | 4.482 | 4.554 |
| Pivot points | S3 | S2 | S1 | PP | R1 | R2 | R3 |
|---|---|---|---|---|---|---|---|
| Standard | 3.854 | 4.028 | 4.202 | 4.376 | 4.550 | 4.724 | 4.898 |
| Camarilla | 4.280 | 4.312 | 4.344 | 4.376 | 4.408 | 4.440 | 4.472 |
| Woodie | 3.854 | 4.028 | 4.202 | 4.376 | 4.550 | 4.724 | 4.898 |
| Fibonacci | 4.028 | 4.161 | 4.243 | 4.376 | 4.509 | 4.591 | 4.724 |
Numerical data
The following is the status of technical indicators and moving averages registered at the time this technical analysis was created:
| RSI (14): | 50.89 | |
| MACD (12,26,9): | -0.0120 | |
| Directional Movement: | 2.989 | |
| AROON (14): | -50.000 | |
| DEMA (21): | 4.400 | |
| Parabolic SAR (0,02-0,02-0,2): | 4.280 | |
| Elder Ray (13): | -0.002 | |
| Super Trend (3,10): | 4.563 | |
| Zig ZAG (10): | 4.422 | |
| VORTEX (21): | 1.0160 | |
| Stochastique (14,3,5): | 38.03 | |
| TEMA (21): | 4.386 | |
| Williams %R (14): | -47.41 | |
| Chande Momentum Oscillator (20): | -0.104 | |
| Repulse (5,40,3): | -0.6520 | |
| ROCnROLL: | -1 | |
| TRIX (15,9): | 0.0110 | |
| Courbe Coppock: | 5.53 |
| MA7: | 4.360 | |
| MA20: | 4.446 | |
| MA50: | 4.399 | |
| MA100: | 4.438 | |
| MAexp7: | 4.387 | |
| MAexp20: | 4.409 | |
| MAexp50: | 4.422 | |
| MAexp100: | 4.467 | |
| Price / MA7: | +1.42% | |
| Price / MA20: | -0.54% | |
| Price / MA50: | +0.52% | |
| Price / MA100: | -0.36% | |
| Price / MAexp7: | +0.80% | |
| Price / MAexp20: | +0.29% | |
| Price / MAexp50: | -0% | |
| Price / MAexp100: | -1.01% |
News
The latest news and videos published on NH HOTEL at the time of the analysis were as follows:
 NH Hotel Group
About author

Online


Add a comment
Comments
0 comments on the analysis MINOR HOTELS - Daily